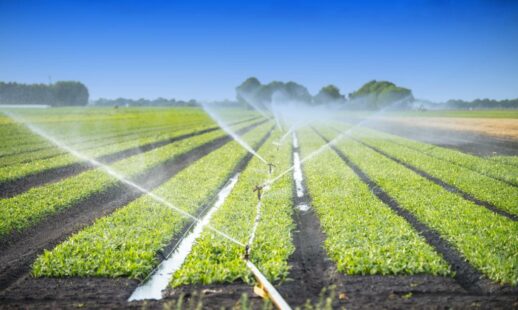
Irrigation covers only 5% of Australia’s tilled agricultural land but delivers 30% of total agricultural output. Agriculture utilises 50-70 percent of Australia’s annual water use, with irrigation accounting for 90 percent of that. Regulations and licences govern the vast bulk of irrigated water use. Irrigators require a permit to draw specific amounts of water from rivers, bores (groundwater), or irrigation supply networks. Australia receives 2,789,400 GL of rainfall on average every year, according to estimates. 8 percent (242,800 gallons) goes off as surface water, while 2% (49,200 gallons) recharges groundwater. The remaining water evaporates or is consumed by plants. Agriculture accounts for 50-70 percent of Australia’s water usage, depending on the season, according to national water budgets. Agriculture cuts its use by a greater percentage than other consumers during drought years. In periods of improved water availability, it is projected that irrigation usage will rise once more.
Horticulture (fruit, nuts, vegetables, and nurseries), grapes, rice, and cotton are just a few examples of agricultural commodities that rely heavily on irrigation. Others, like dairy and sugar, are extremely dependant in certain areas or seasons. The amount of water available for irrigation, as well as the crops that require it, vary from year to year. During the current drought, rice production in Australia nearly ended, cotton production fell, and dairy farmers compensated for lower production by using purchased feeds instead of irrigated pastures. The type of irrigation system employed is determined by the availability of water, the delivery method (piped or channel), crop varieties, soils, and landform. There are also financial and operational considerations.
Despite the return of rain in eastern Australia in early 2020, national rainfall was below average, with 2019-20 being the sixth driest year on record. In 2019-20, reduced water availability and rising water costs were the driving forces behind a further drop in irrigation activities. Irrigators lowered the size of their crops and/or shifted to crops that did not require as much water. Only fruit, nuts, and grapevines showed a rise in irrigation area and volume from 2018 to 2019, due to growers’ limited alternatives for changing irrigation strategies.
Australian farms used a total of 6.5 million megalitres of water taken from various sources including:

As the number of solar farms in Australia grows, so does the controversy over heavy metals in solar panels and the difficulty of recycling them. Lynette LaBlack, a farmer in the Riverina region of southern New South Wales, has been questioning everyone who will listen with uncomfortable questions. She questioned Metka EGN regarding its solar […]
Read More →
Irrigation covers only 5% of Australia’s tilled agricultural land but delivers 30% of total agricultural output. Agriculture utilises 50-70 percent of Australia’s annual water use, with irrigation accounting for 90 percent of that. Regulations and licences govern the vast bulk of irrigated water use. Irrigators require a permit to draw specific amounts of water from […]
Read More →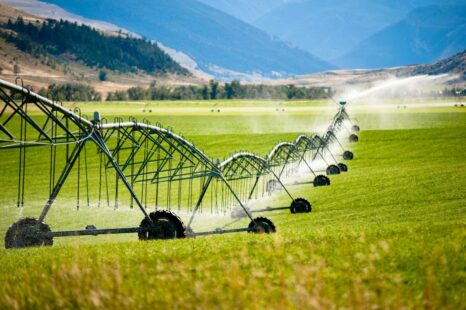
How do you improve productivity and yield, while conserving precious water supplies? This is a question farmers across the globe have grappled with for decades, but a reputed company SupPlant is on a mission to provide them with the answer. The Israeli-based start-up is using agronomic algorithms, artificial intelligence and cloud-based technology to meet this […]
Read More →