Short-Term and Long-Term PALM: How the Workforce Mix Has Changed
• Hari Yellina
PALM data series | Data period: August 2026 | Reviewed: 26 October 2026
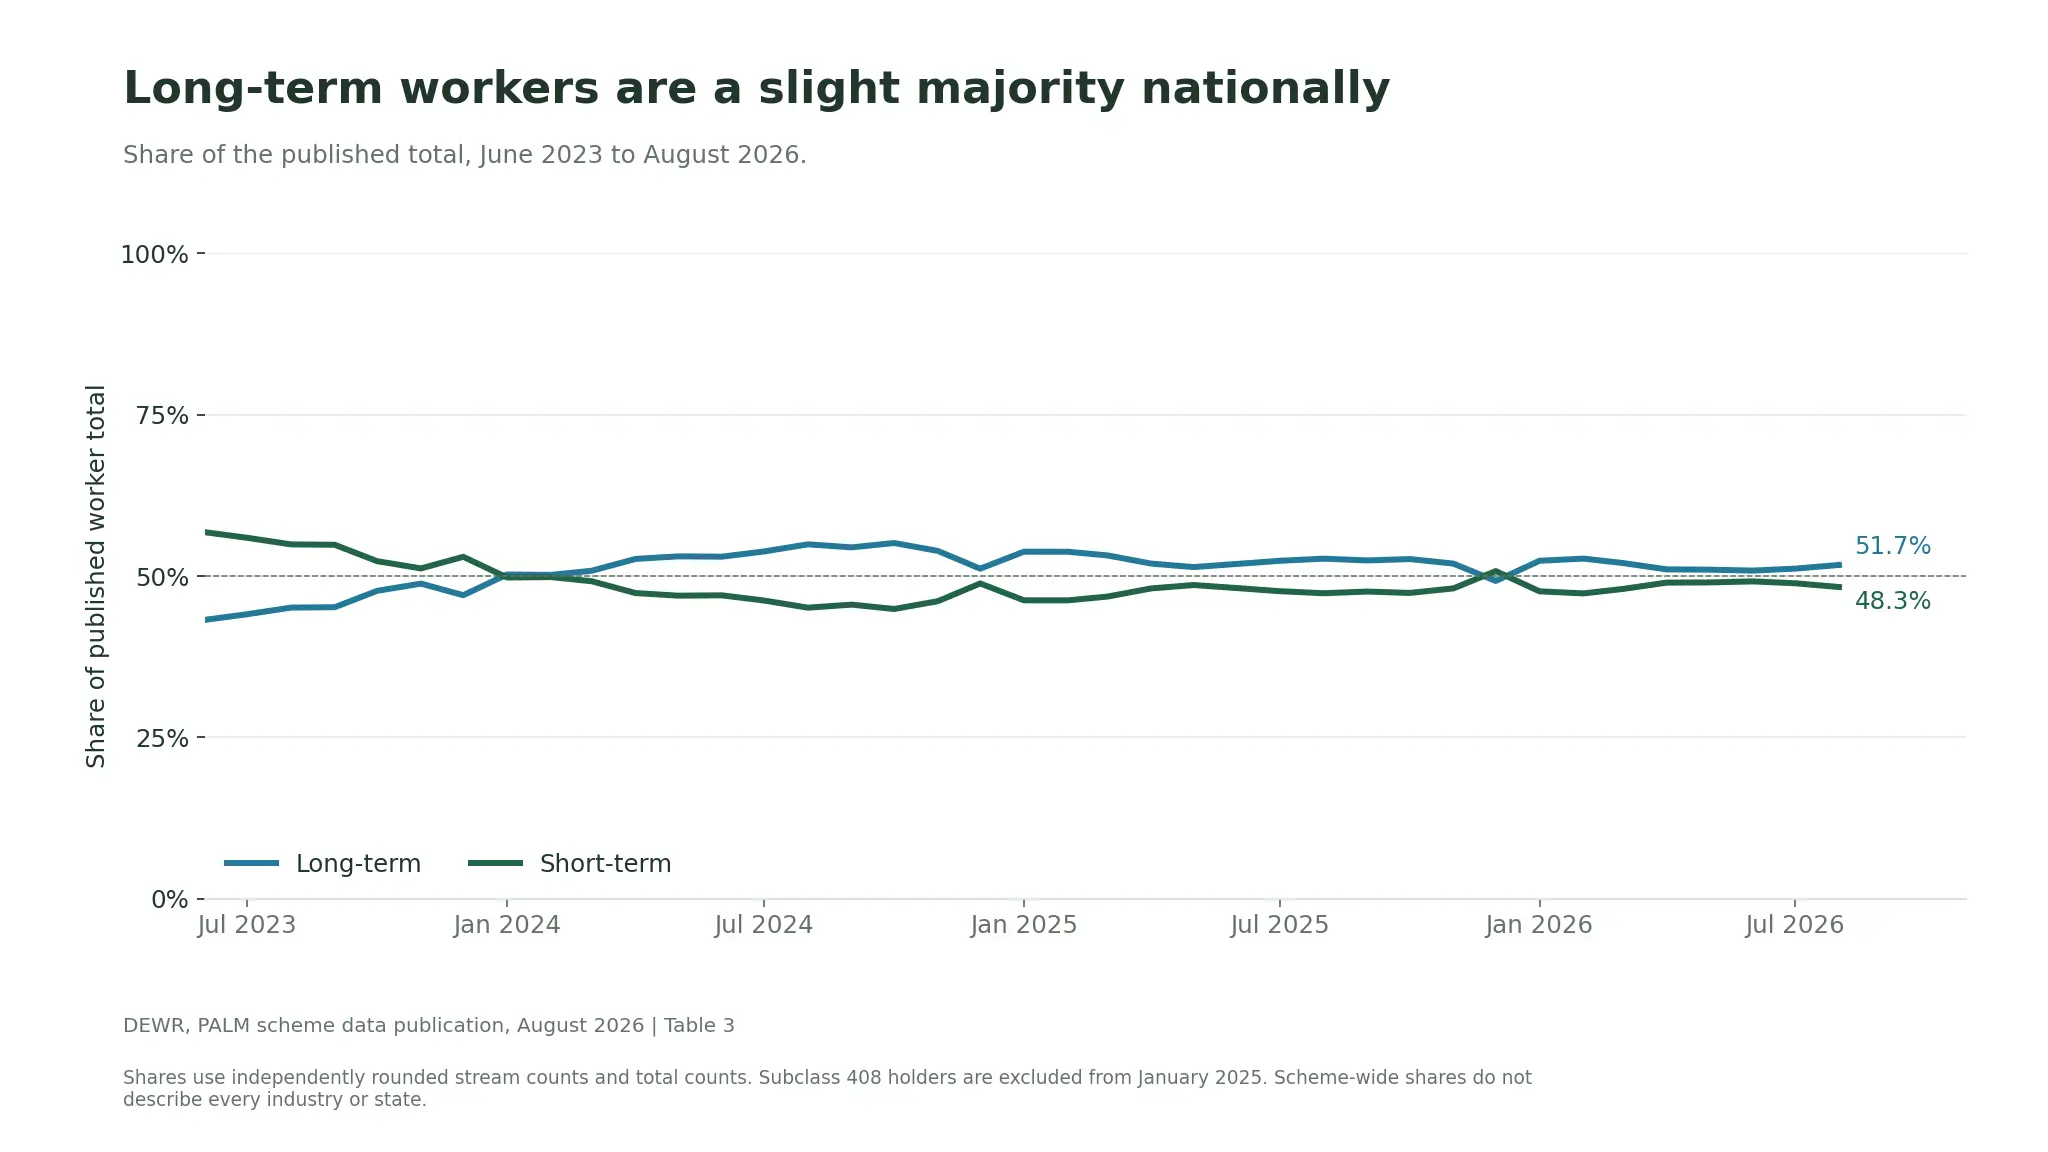
Long-term workers made up a slight majority of PALM participation in August 2026: 16,340 people, or approximately 51.7% of the published total. The short-term count was 15,260, or approximately 48.3%.
That near-even national split is a starting point. The stream mix looks very different in agriculture, meat processing and health care. Understanding those differences helps a grower interpret the scheme without assuming its national average describes the proposed work.
Read the mix alongside the actual counts
A share measures the size of one group relative to a total. It can change because that group grows, because another group shrinks, or because both change at different rates. Looking at the percentage alone can hide those movements.
In August 2025, the workbook recorded 14,300 short-term workers and 15,920 long-term workers. By August 2026, the respective counts were 15,260 and 16,340. Both groups increased, but the short-term count increased more in absolute terms. Long-term participation’s share consequently moved from approximately 52.7% to 51.7%.
View the data behind this graph
| Month | Short term pct | Long term pct |
|---|---|---|
| 2023-06 | 56.8 | 43.2 |
| 2023-07 | 55.9 | 44.1 |
| 2023-08 | 54.9 | 45.1 |
| 2023-09 | 54.8 | 45.2 |
| 2023-10 | 52.3 | 47.7 |
| 2023-11 | 51.2 | 48.8 |
| 2023-12 | 53.0 | 47.0 |
| 2024-01 | 49.8 | 50.2 |
| 2024-02 | 49.8 | 50.2 |
| 2024-03 | 49.2 | 50.8 |
| 2024-04 | 47.4 | 52.6 |
| 2024-05 | 47.0 | 53.0 |
| 2024-06 | 47.0 | 53.0 |
| 2024-07 | 46.2 | 53.8 |
| 2024-08 | 45.1 | 54.9 |
| 2024-09 | 45.6 | 54.4 |
| 2024-10 | 44.9 | 55.1 |
| 2024-11 | 46.1 | 53.9 |
| 2024-12 | 48.8 | 51.1 |
| 2025-01 | 46.2 | 53.8 |
| 2025-02 | 46.2 | 53.8 |
| 2025-03 | 46.8 | 53.2 |
| 2025-04 | 48.1 | 51.9 |
| 2025-05 | 48.6 | 51.4 |
| 2025-06 | 48.1 | 51.9 |
| 2025-07 | 47.6 | 52.4 |
| 2025-08 | 47.3 | 52.7 |
| 2025-09 | 47.6 | 52.4 |
| 2025-10 | 47.4 | 52.6 |
| 2025-11 | 48.1 | 51.9 |
| 2025-12 | 50.8 | 49.2 |
| 2026-01 | 47.6 | 52.4 |
| 2026-02 | 47.3 | 52.7 |
| 2026-03 | 48.0 | 52.0 |
| 2026-04 | 49.0 | 51.0 |
| 2026-05 | 49.0 | 51.0 |
| 2026-06 | 49.2 | 50.8 |
| 2026-07 | 48.9 | 51.1 |
| 2026-08 | 48.3 | 51.7 |
The longer graph provides context but includes a change in coverage. Relevant subclass 408 visa holders were included where possible up to December 2024 and are excluded from January 2025. Avoid presenting every change across that boundary as a change in recruitment behaviour.
December counts can be affected by workers returning home temporarily for holidays. This seasonal caveat also applies after January 2025. The data alone does not identify why the short-term or long-term share changes in a particular month.
Industry composition explains why the national average is limited
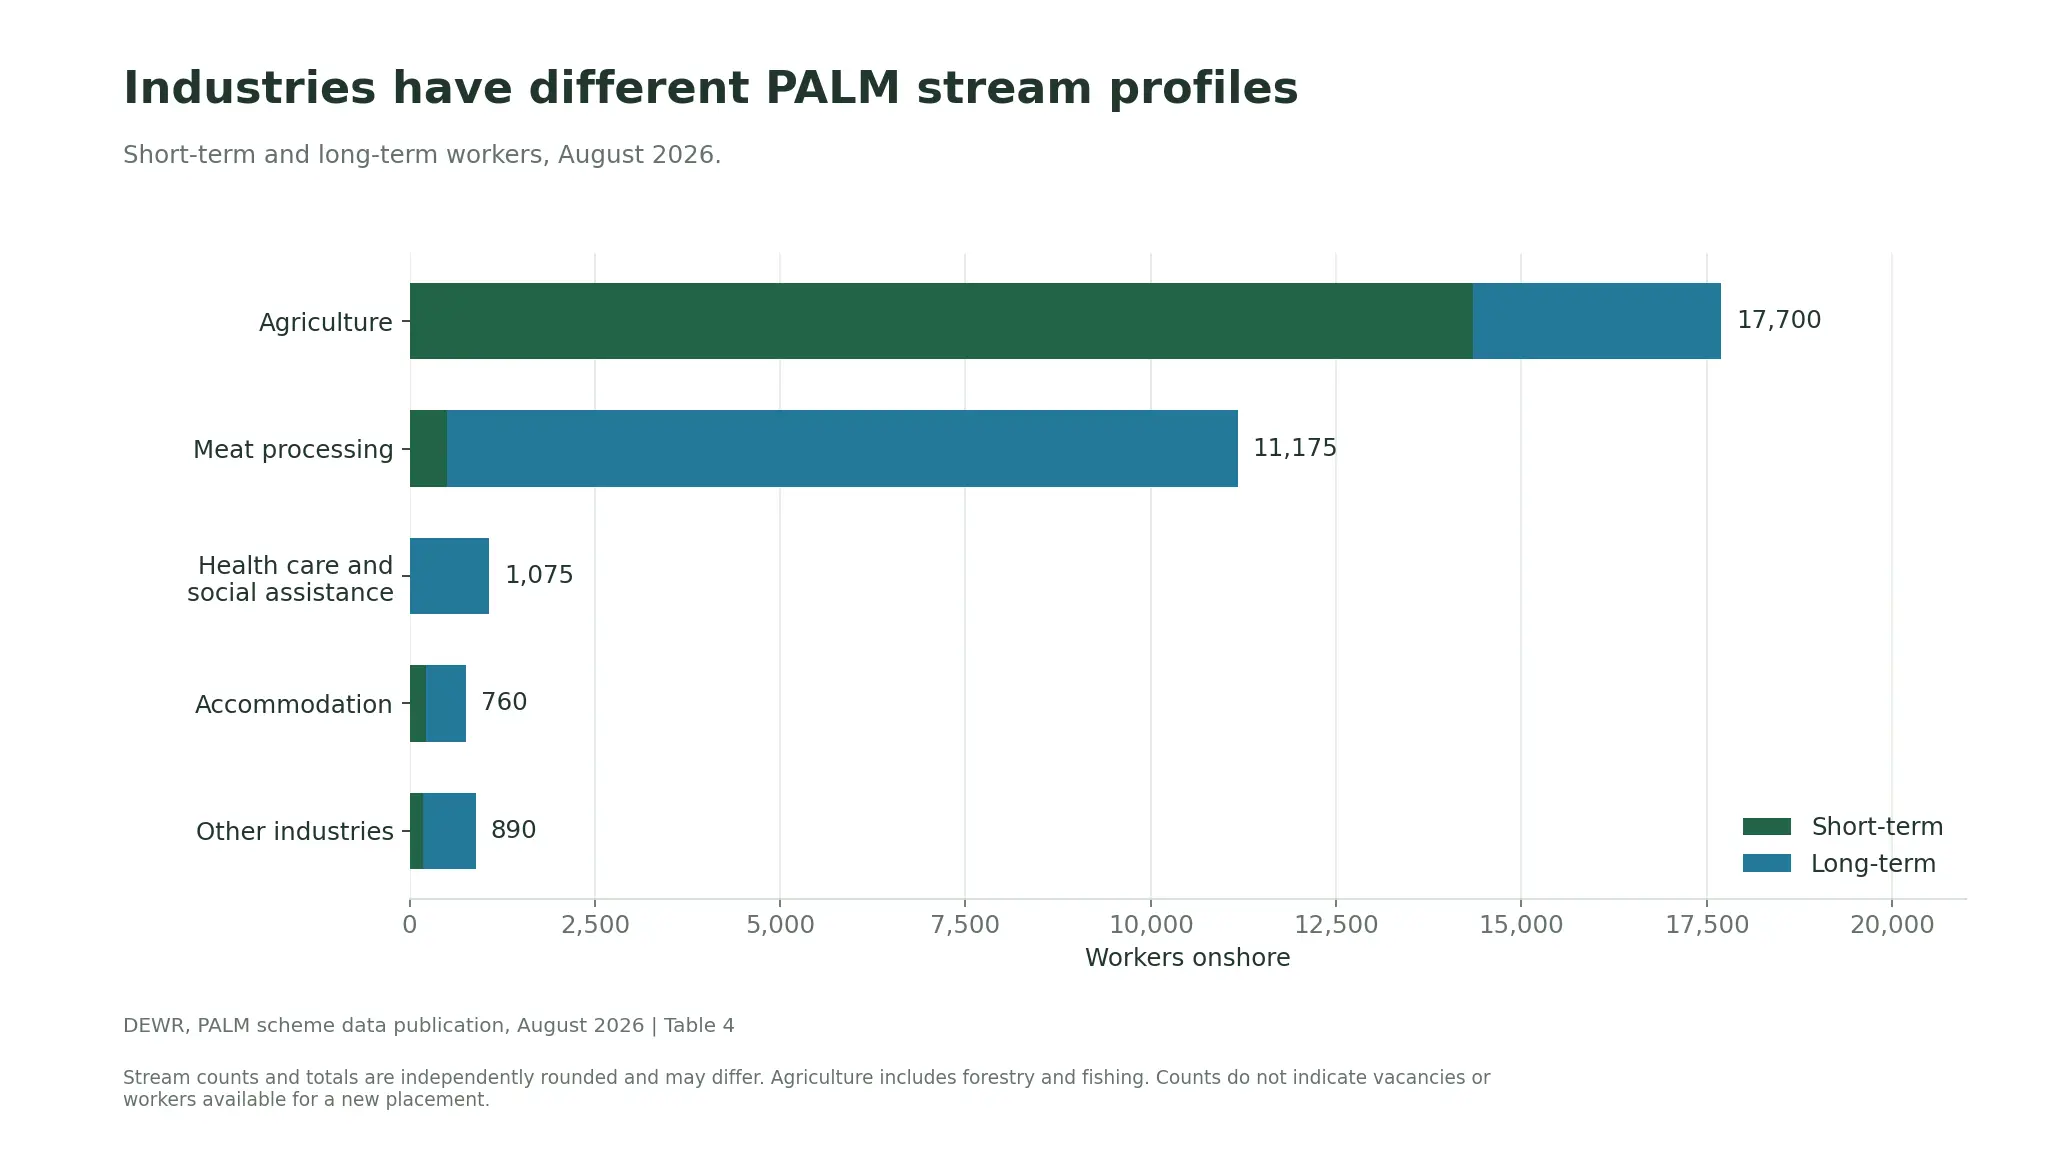
Agriculture recorded 14,350 short-term and 3,345 long-term workers in August 2026. The corresponding meat-processing counts were 505 and 10,670. Health care and social assistance recorded no short-term participants and 1,075 long-term participants in this release.
Accommodation recorded 220 short-term and 540 long-term workers, while other industries recorded 185 and 705. Worker figures are independently rounded, so some components differ slightly from the published totals. The workbook’s Accommodation group covers ANZSIC Division H, accommodation and food services, rather than lodging alone.
View the data behind this graph
| Industry | Short term | Long term | Published total |
|---|---|---|---|
| Agriculture | 14,350 | 3,345 | 17,700 |
| Meat processing | 505 | 10,670 | 11,175 |
| Health care and social assistance | 0 | 1,075 | 1,075 |
| Accommodation | 220 | 540 | 760 |
| Other industries | 185 | 705 | 890 |
These distributions describe the workforce recorded at that point in time. They do not prove that a particular role must belong to one stream, establish that a proposed placement is approved, or explain why an individual participated in a particular stream.
Keep the statistical label separate from the placement decision
A manager may see the large short-term agriculture group and conclude that any harvest request will fit readily into that pattern. The next step should instead be to define the actual work and check the applicable arrangements for the proposed placement.
List the anticipated duration, expected hours, location and capabilities required. Identify who will supervise the work and how accommodation and transport will operate. The dataset supplies none of those answers for an individual employer.
Our recruitment timeline guide explains the importance of allowing time for the process. The PALM payroll guide addresses employment matters that cannot be inferred from a participation chart. Check the current scheme requirements for the actual proposed arrangement.
Use the same denominator when comparing shares
The graph divides each stream’s worker count by the published total for the same month. It does not divide by all agricultural workers in Australia or by all jobs in that industry. A 51.7% long-term PALM share is therefore not a statement about the wider Australian labour market.
Keep the source period visible whenever a graph is reused in a presentation. Do not mix an August stream count with a June total, or use a newer publication for one side of a comparison while leaving an older, unrevised value on the other.
For a fuller picture, read the state comparison. State and industry patterns can both inform the questions a grower asks, while the final staffing plan remains grounded in confirmed work and placement evidence.
Explore the PALM data series
- PALM Scheme in August 2026: The Numbers Behind the Workforce
- 17,700 PALM Workers in Agriculture: What the Data Means for Growers
- PALM Workers Across Australia: A State Comparison with a Victorian Focus
- Ten PALM Country Profiles: Participation, Trends and Stream Mix
- Women in the PALM Scheme: What Participation Data Shows
- 565 Approved Employers: Understanding Direct Employment and Labour Hire
- Why PALM Numbers Rise and Fall: Reading Seasonal Workforce Data
Source and method
Source: DEWR PALM scheme data, August 2026 workbook and June 2026 quarterly report, checked 26 October 2026. Charts and calculations are Orchard Tech’s analysis. Worker counts are privacy-rounded to the nearest five; components may not sum to totals. Employer counts are not rounded. Percentages calculated from rounded counts are approximate.
The views expressed in this report are those of the authors and do not necessarily represent those of DEWR.
About the author
Hari Yellina is Chief Executive Officer at Orchard Tech. His articles cover agricultural workforce planning, labour hire and practical workplace responsibilities.