Women in the PALM Scheme: What Participation Data Shows
• Hari Yellina
PALM data series | Data period: August 2026 | Reviewed: 26 October 2026
The August 2026 PALM release records 5,735 female workers, approximately 18.1% of the 31,600 participants onshore. The overall percentage is useful, but it conceals substantial differences between industries.
This article uses the publication’s sex categories. The figures describe participation recorded in administrative data; they do not explain individual identity, preferences, recruitment experiences or the reasons participation differs.
The industry pattern is more informative than one average
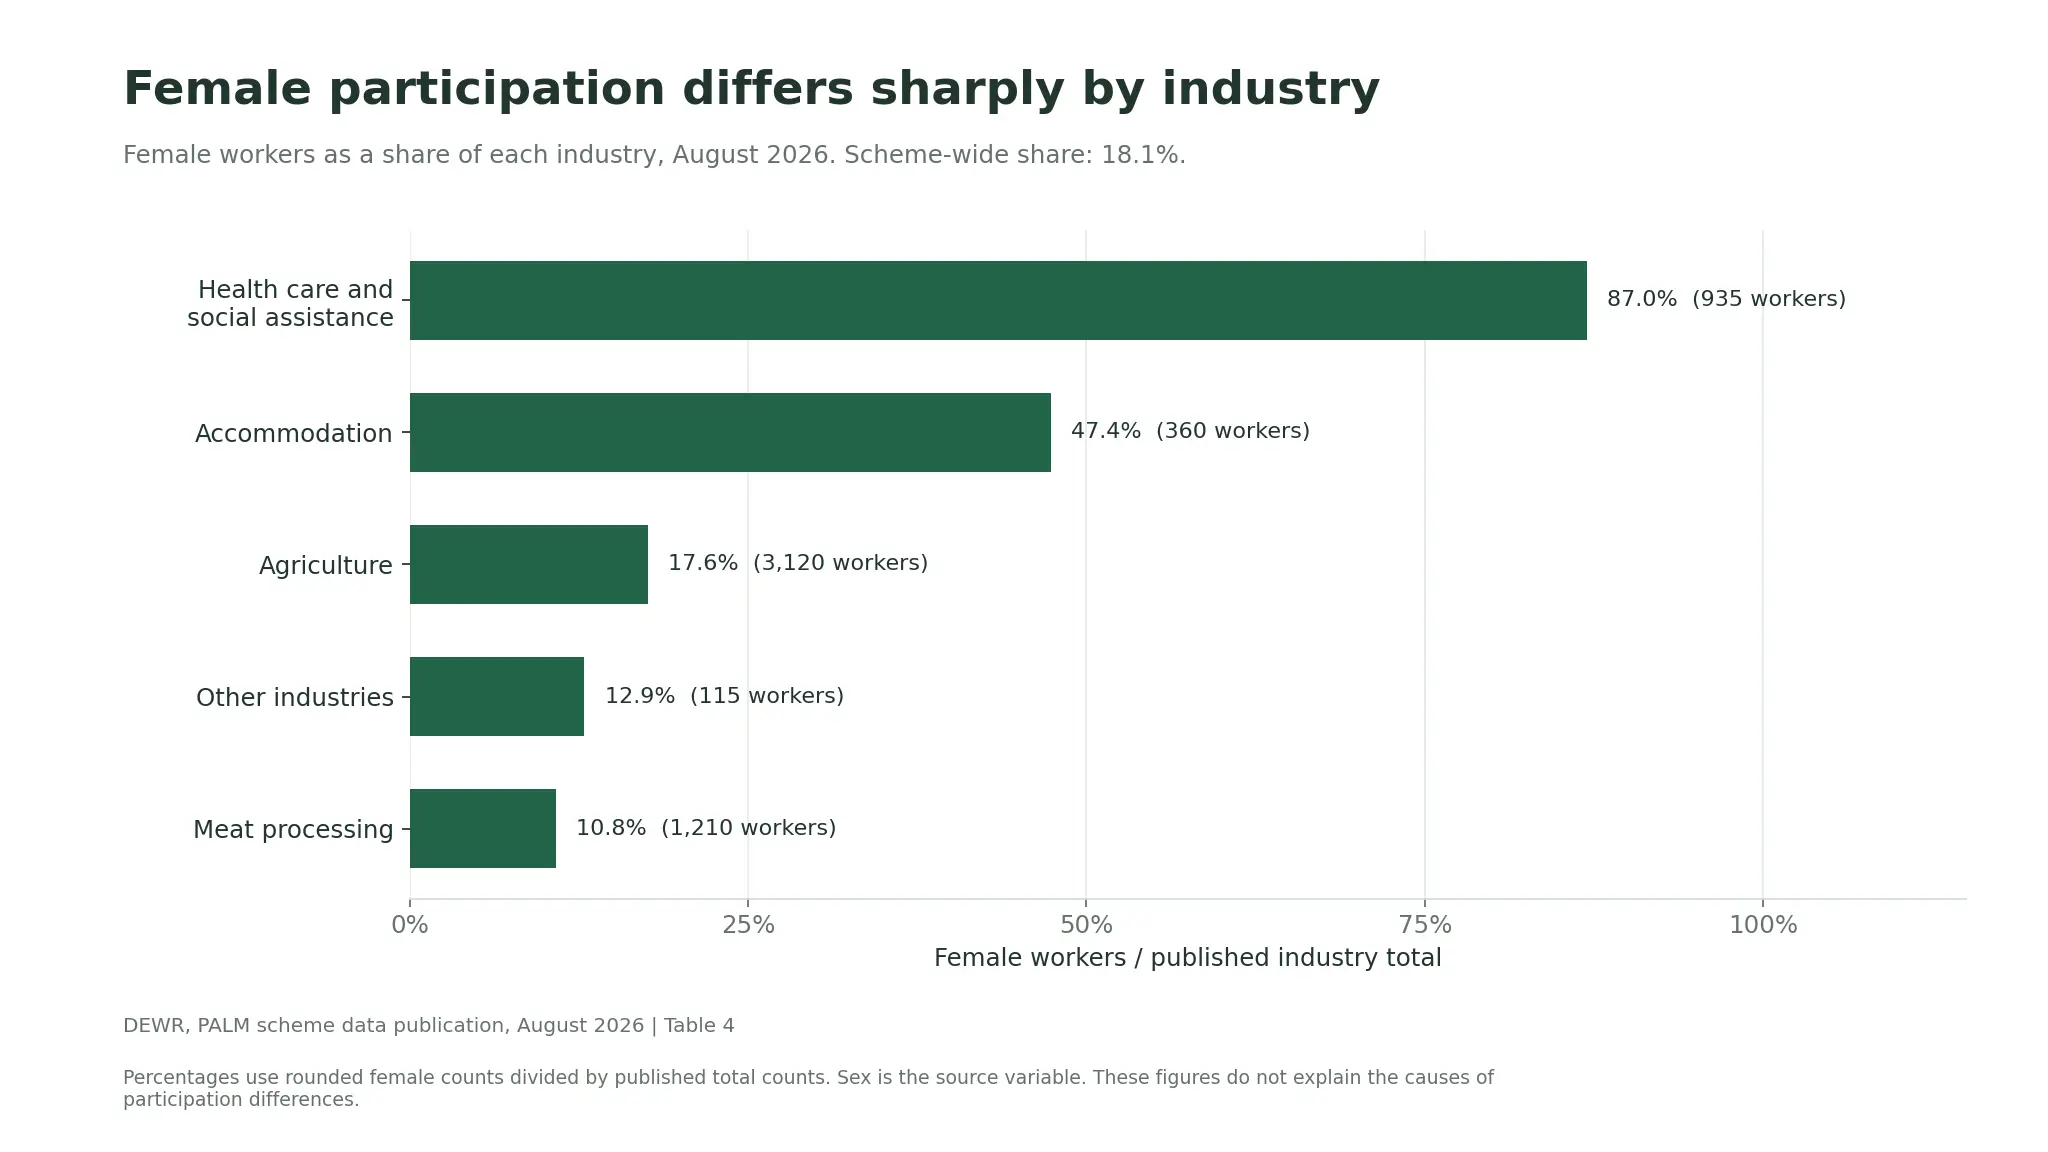
Health care and social assistance recorded 935 female workers out of 1,075 participants, approximately 87.0%. Accommodation recorded 360 out of 760, approximately 47.4%. Agriculture recorded 3,120 out of 17,700, approximately 17.6%.
Other industries recorded 115 female workers out of 890, approximately 12.9%, while meat processing recorded 1,210 out of 11,175, approximately 10.8%. The chart uses each industry’s own published total as the denominator.
View the data behind this graph
| Industry | Female workers | Total workers | Female share pct |
|---|---|---|---|
| Health care and social assistance | 935 | 1,075 | 87.0 |
| Accommodation | 360 | 760 | 47.4 |
| Agriculture | 3,120 | 17,700 | 17.6 |
| Other industries | 115 | 890 | 12.9 |
| Meat processing | 1,210 | 11,175 | 10.8 |
Counts and shares answer different questions. Agriculture has a lower female participation share than health care, but a larger number of female participants. A discussion about the number of people needing facilities or support should therefore include counts as well as percentages.
The national share has changed over time
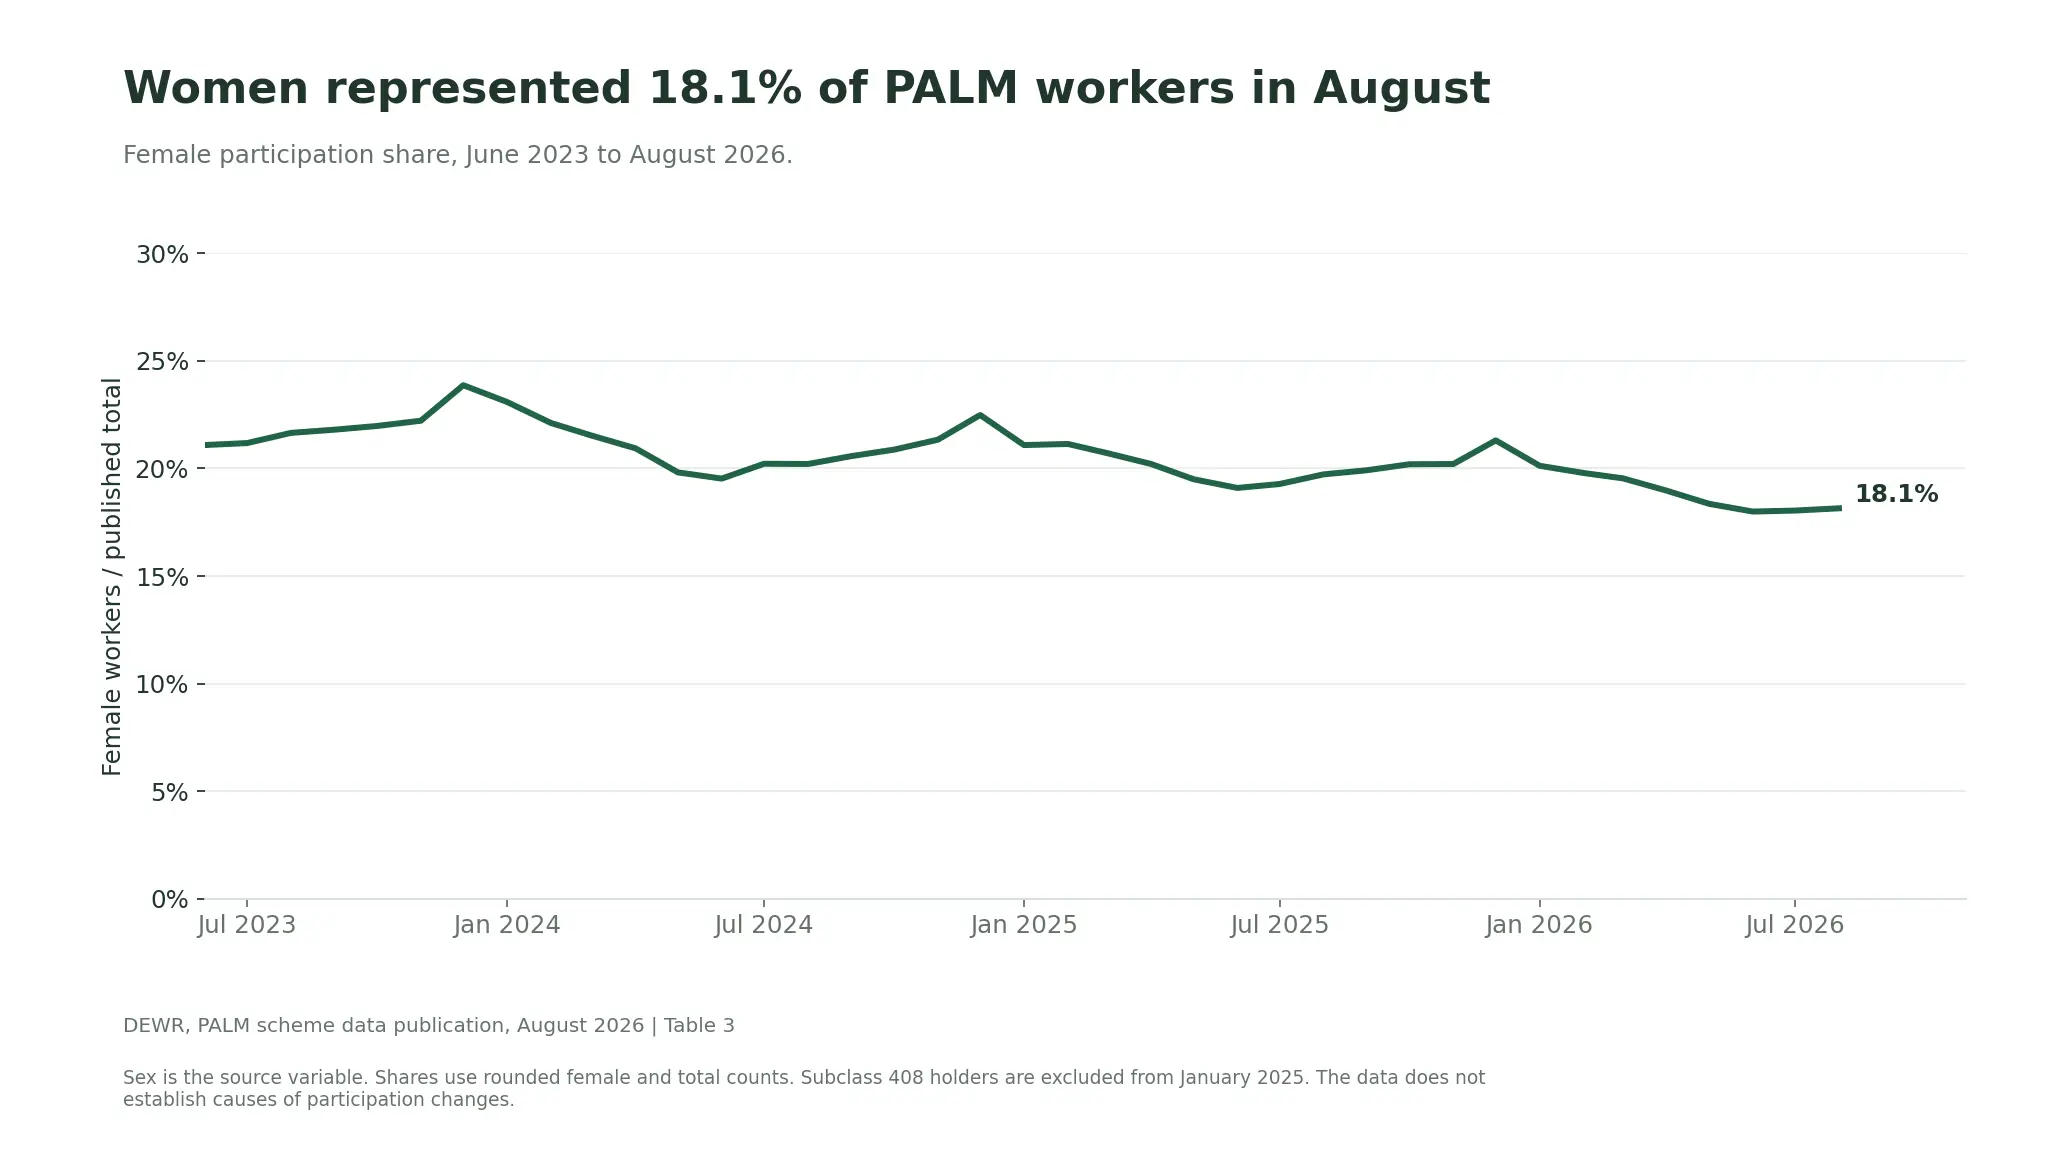
The historical chart compares the recorded female count with the published total in each month. In June 2023, the workbook recorded 7,255 female workers out of 34,400 participants, approximately 21.1%. In August 2026, the share was approximately 18.1%.
That is a descriptive comparison, not an explanation of why the share changed. The industry mix, stream mix and other factors may be relevant to further analysis. This workbook does not isolate their effects or establish a causal relationship.
View the data behind this graph
| Month | Female workers | Total | Female share pct |
|---|---|---|---|
| 2023-06 | 7,255 | 34,400 | 21.1 |
| 2023-07 | 7,225 | 34,110 | 21.2 |
| 2023-08 | 7,325 | 33,825 | 21.7 |
| 2023-09 | 7,595 | 34,830 | 21.8 |
| 2023-10 | 7,450 | 33,900 | 22.0 |
| 2023-11 | 7,310 | 32,895 | 22.2 |
| 2023-12 | 7,140 | 29,910 | 23.9 |
| 2024-01 | 7,420 | 32,130 | 23.1 |
| 2024-02 | 7,350 | 33,230 | 22.1 |
| 2024-03 | 7,060 | 32,795 | 21.5 |
| 2024-04 | 6,820 | 32,575 | 20.9 |
| 2024-05 | 6,715 | 33,885 | 19.8 |
| 2024-06 | 6,685 | 34,230 | 19.5 |
| 2024-07 | 6,460 | 31,950 | 20.2 |
| 2024-08 | 6,225 | 30,805 | 20.2 |
| 2024-09 | 6,375 | 30,980 | 20.6 |
| 2024-10 | 6,430 | 30,800 | 20.9 |
| 2024-11 | 6,680 | 31,305 | 21.3 |
| 2024-12 | 6,130 | 27,260 | 22.5 |
| 2025-01 | 6,475 | 30,705 | 21.1 |
| 2025-02 | 6,595 | 31,195 | 21.1 |
| 2025-03 | 6,485 | 31,310 | 20.7 |
| 2025-04 | 6,305 | 31,200 | 20.2 |
| 2025-05 | 6,135 | 31,460 | 19.5 |
| 2025-06 | 5,930 | 31,055 | 19.1 |
| 2025-07 | 5,875 | 30,475 | 19.3 |
| 2025-08 | 5,960 | 30,215 | 19.7 |
| 2025-09 | 6,220 | 31,225 | 19.9 |
| 2025-10 | 6,440 | 31,885 | 20.2 |
| 2025-11 | 6,540 | 32,365 | 20.2 |
| 2025-12 | 6,080 | 28,535 | 21.3 |
| 2026-01 | 6,435 | 31,970 | 20.1 |
| 2026-02 | 6,435 | 32,515 | 19.8 |
| 2026-03 | 6,395 | 32,725 | 19.5 |
| 2026-04 | 6,290 | 33,160 | 19.0 |
| 2026-05 | 6,035 | 32,875 | 18.4 |
| 2026-06 | 5,875 | 32,645 | 18.0 |
| 2026-07 | 5,745 | 31,840 | 18.0 |
| 2026-08 | 5,735 | 31,600 | 18.1 |
The series also crosses the January 2025 change in coverage for relevant subclass 408 visa holders. Worker counts are rounded independently, which means female and male counts may not sum exactly to the published total. A small difference should not be interpreted as a new category of people without consulting the source definitions.
Use the data to ask better workplace questions
For a grower or host, the practical response is to examine whether the actual workplace and recruitment process support the people doing the work. This is a management review prompted by the figures, not a conclusion that any individual farm has a particular problem.
Review how job requirements are described, how capabilities are assessed and how workers can raise concerns. Check whether clothing and equipment fit the people using them, whether facilities offer appropriate privacy, and whether communication arrangements are understood.
Seek feedback from workers rather than assuming the national percentage reveals their experience. A useful conversation asks what makes a task or facility difficult to use and what change would help. Record the action, responsible person and follow-up date.
Keep participation, opportunity and outcomes separate
A participation figure is not a direct measure of equal opportunity, retention, pay equity or safety. Those questions need evidence designed to answer them. For example, an employer seeking to understand recruitment outcomes would need information about applications and selection stages, with appropriate handling of personal data.
Equally, the higher female share in one industry is not evidence that women are inherently more suited to that work. Decisions about a role should use its legitimate requirements and the capability of the individual concerned.
Our farm facilities guide helps turn a general concern into a site check. The welfare follow-up guide explains how to give worker conversations a clear next action.
Read the national PALM overview for the wider context. When reusing this graph, keep the month and industry labels visible so the figures remain understandable.
Explore the PALM data series
- PALM Scheme in August 2026: The Numbers Behind the Workforce
- 17,700 PALM Workers in Agriculture: What the Data Means for Growers
- PALM Workers Across Australia: A State Comparison with a Victorian Focus
- Short-Term and Long-Term PALM: How the Workforce Mix Has Changed
- Ten PALM Country Profiles: Participation, Trends and Stream Mix
- 565 Approved Employers: Understanding Direct Employment and Labour Hire
- Why PALM Numbers Rise and Fall: Reading Seasonal Workforce Data
Source and method
Source: DEWR PALM scheme data, August 2026 workbook and June 2026 quarterly report, checked 26 October 2026. Charts and calculations are Orchard Tech’s analysis. Worker counts are privacy-rounded to the nearest five; components may not sum to totals. Employer counts are not rounded. Percentages calculated from rounded counts are approximate.
The views expressed in this report are those of the authors and do not necessarily represent those of DEWR.
About the author
Hari Yellina is Chief Executive Officer at Orchard Tech. His articles cover agricultural workforce planning, labour hire and practical workplace responsibilities.