PALM Scheme in August 2026: The Numbers Behind the Workforce
• Hari Yellina
PALM data series | Data period: August 2026 | Reviewed: 26 October 2026
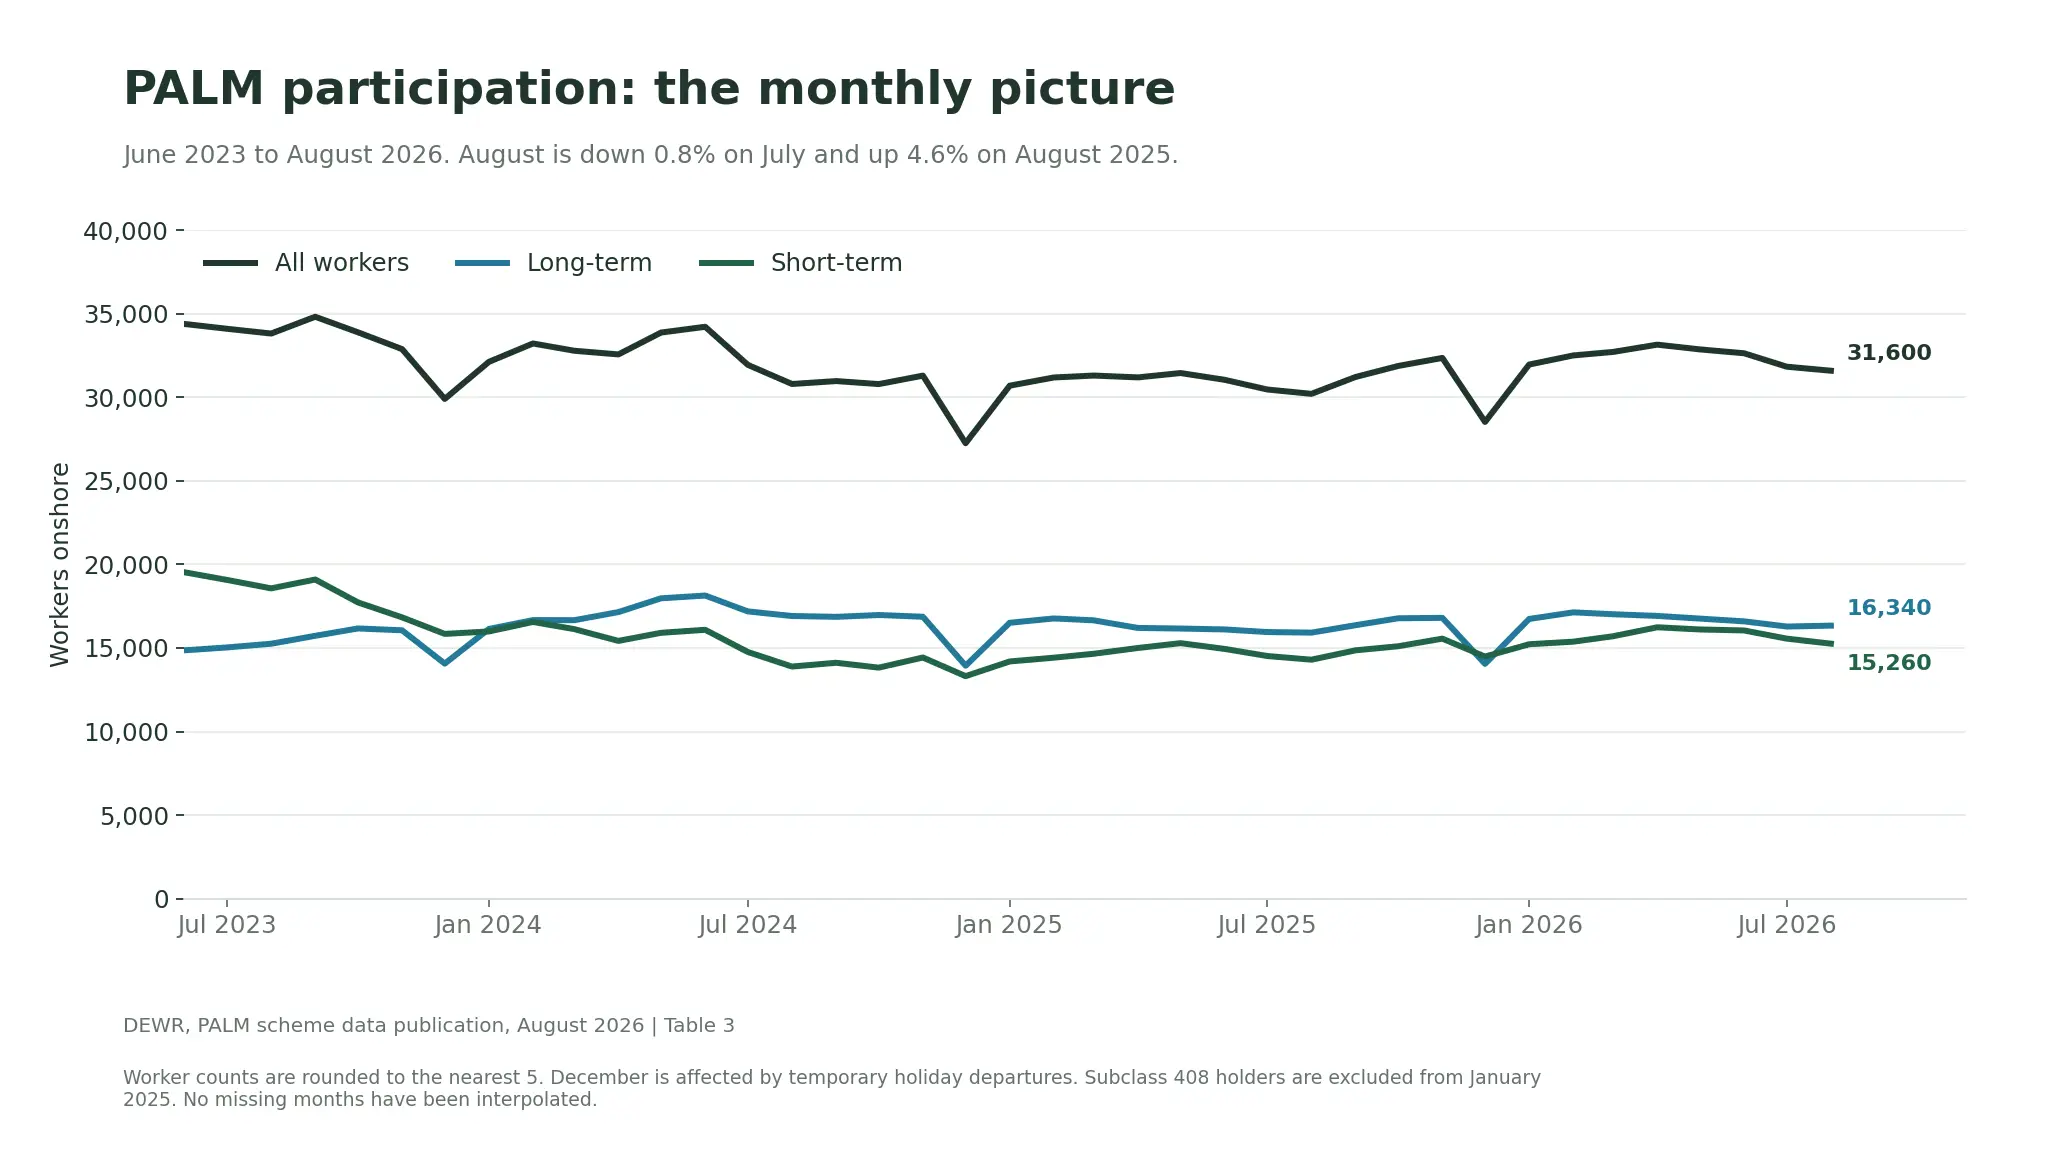
The August 2026 PALM scheme statistics tell two stories at once. Australia had 31,600 participating workers onshore, 240 fewer than in July. Yet the total was 1,385 higher than in August 2025. The monthly change was approximately -0.8%; the annual change was +4.6%.
For a grower considering the next season, both comparisons are useful. The first describes a recent movement. The second compares the same point in the calendar. Neither tells a farm how many people can start work on a particular Monday.
Read the reporting period before the headline
August is the latest monthly release available when this article was reviewed on 26 October 2026. These are August observations, not a live October headcount. The figures come from the Department of Employment and Workplace Relations (DEWR), which publishes administrative data on PALM participation.
The worker measure covers people onshore with a valid visa within the publication’s scope. It excludes visa holders offshore. It is a point-in-time count, so adding twelve monthly totals would count many of the same people repeatedly rather than produce an annual number of unique workers.
View the data behind this graph
| Month | Total | Short term | Long term |
|---|---|---|---|
| 2023-06 | 34,400 | 19,535 | 14,860 |
| 2023-07 | 34,110 | 19,075 | 15,035 |
| 2023-08 | 33,825 | 18,570 | 15,255 |
| 2023-09 | 34,830 | 19,100 | 15,730 |
| 2023-10 | 33,900 | 17,730 | 16,170 |
| 2023-11 | 32,895 | 16,835 | 16,060 |
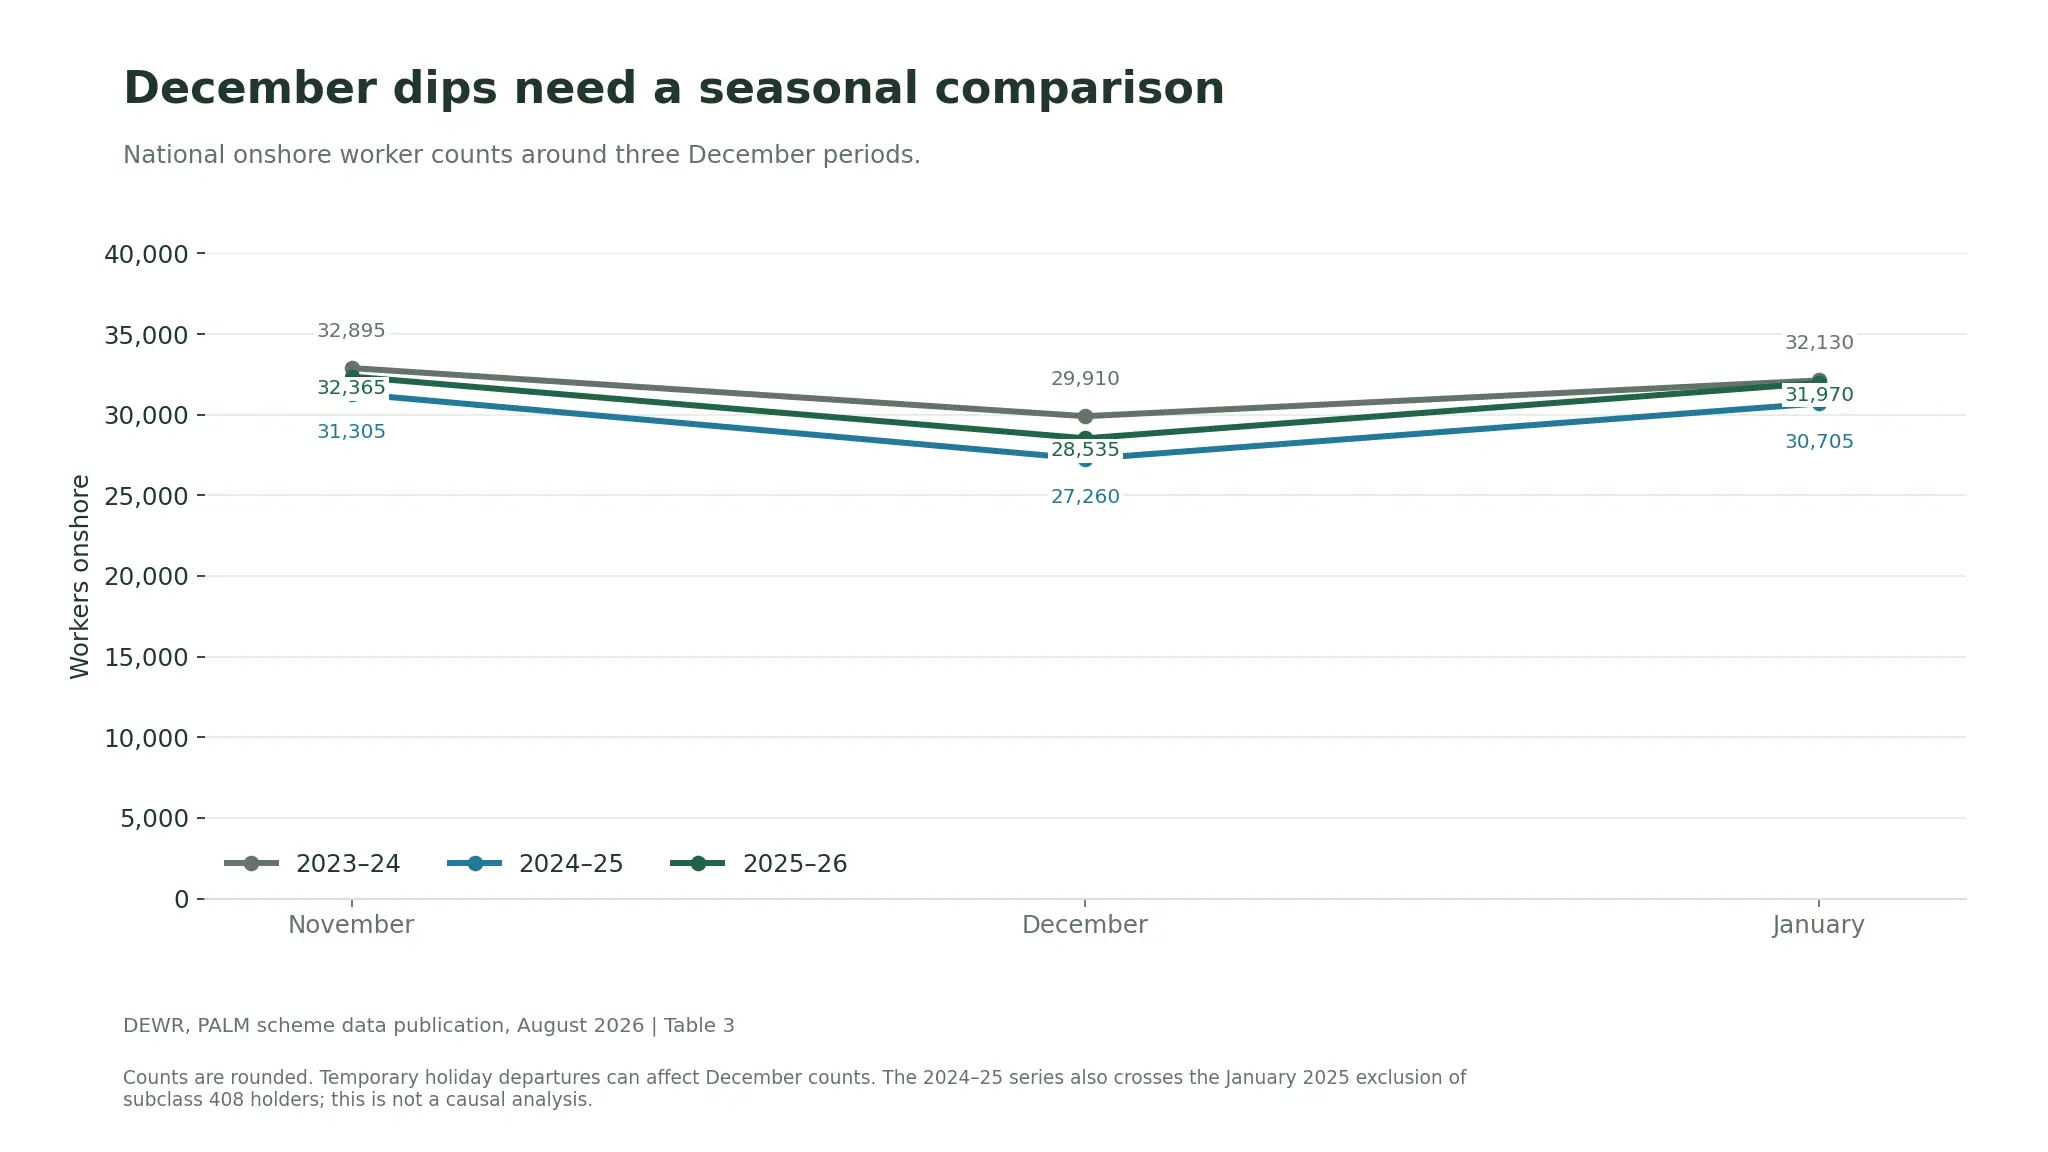
| 2023-12 | 29,910 | 15,845 | 14,065 |
| 2024-01 | 32,130 | 15,990 | 16,140 |
| 2024-02 | 33,230 | 16,560 | 16,670 |
| 2024-03 | 32,795 | 16,130 | 16,665 |
| 2024-04 | 32,575 | 15,425 | 17,150 |
| 2024-05 | 33,885 | 15,910 | 17,975 |
| 2024-06 | 34,230 | 16,090 | 18,140 |
| 2024-07 | 31,950 | 14,760 | 17,190 |
| 2024-08 | 30,805 | 13,890 | 16,915 |
| 2024-09 | 30,980 | 14,115 | 16,865 |
| 2024-10 | 30,800 | 13,825 | 16,975 |
| 2024-11 | 31,305 | 14,430 | 16,870 |
| 2024-12 | 27,260 | 13,315 | 13,940 |
| 2025-01 | 30,705 | 14,195 | 16,510 |
| 2025-02 | 31,195 | 14,420 | 16,770 |
| 2025-03 | 31,310 | 14,655 | 16,655 |
| 2025-04 | 31,200 | 15,000 | 16,200 |
| 2025-05 | 31,460 | 15,290 | 16,165 |
| 2025-06 | 31,055 | 14,945 | 16,110 |
| 2025-07 | 30,475 | 14,520 | 15,955 |
| 2025-08 | 30,215 | 14,300 | 15,920 |
| 2025-09 | 31,225 | 14,860 | 16,365 |
| 2025-10 | 31,885 | 15,105 | 16,780 |
| 2025-11 | 32,365 | 15,560 | 16,805 |
| 2025-12 | 28,535 | 14,485 | 14,050 |
| 2026-01 | 31,970 | 15,225 | 16,740 |
| 2026-02 | 32,515 | 15,380 | 17,135 |
| 2026-03 | 32,725 | 15,705 | 17,020 |
| 2026-04 | 33,160 | 16,240 | 16,920 |
| 2026-05 | 32,875 | 16,110 | 16,760 |
| 2026-06 | 32,645 | 16,050 | 16,595 |
| 2026-07 | 31,840 | 15,560 | 16,285 |
| 2026-08 | 31,600 | 15,260 | 16,340 |
A year-on-year increase sits within a longer pattern
The national total was 30,215 in August 2025 and 31,840 in July 2026. It also stood at 33,825 in August 2023. These reference points show why one favourable comparison should not be presented as continuous growth across the whole series.
December falls are visible in several years. DEWR cautions that seasonal work patterns and temporary returns home for holidays affect participation. The historical series also changes coverage: relevant subclass 408 visa holders cease to be included from January 2025. A longer comparison needs that qualification, even when the line on the graph appears continuous.
Agriculture is the largest industry group
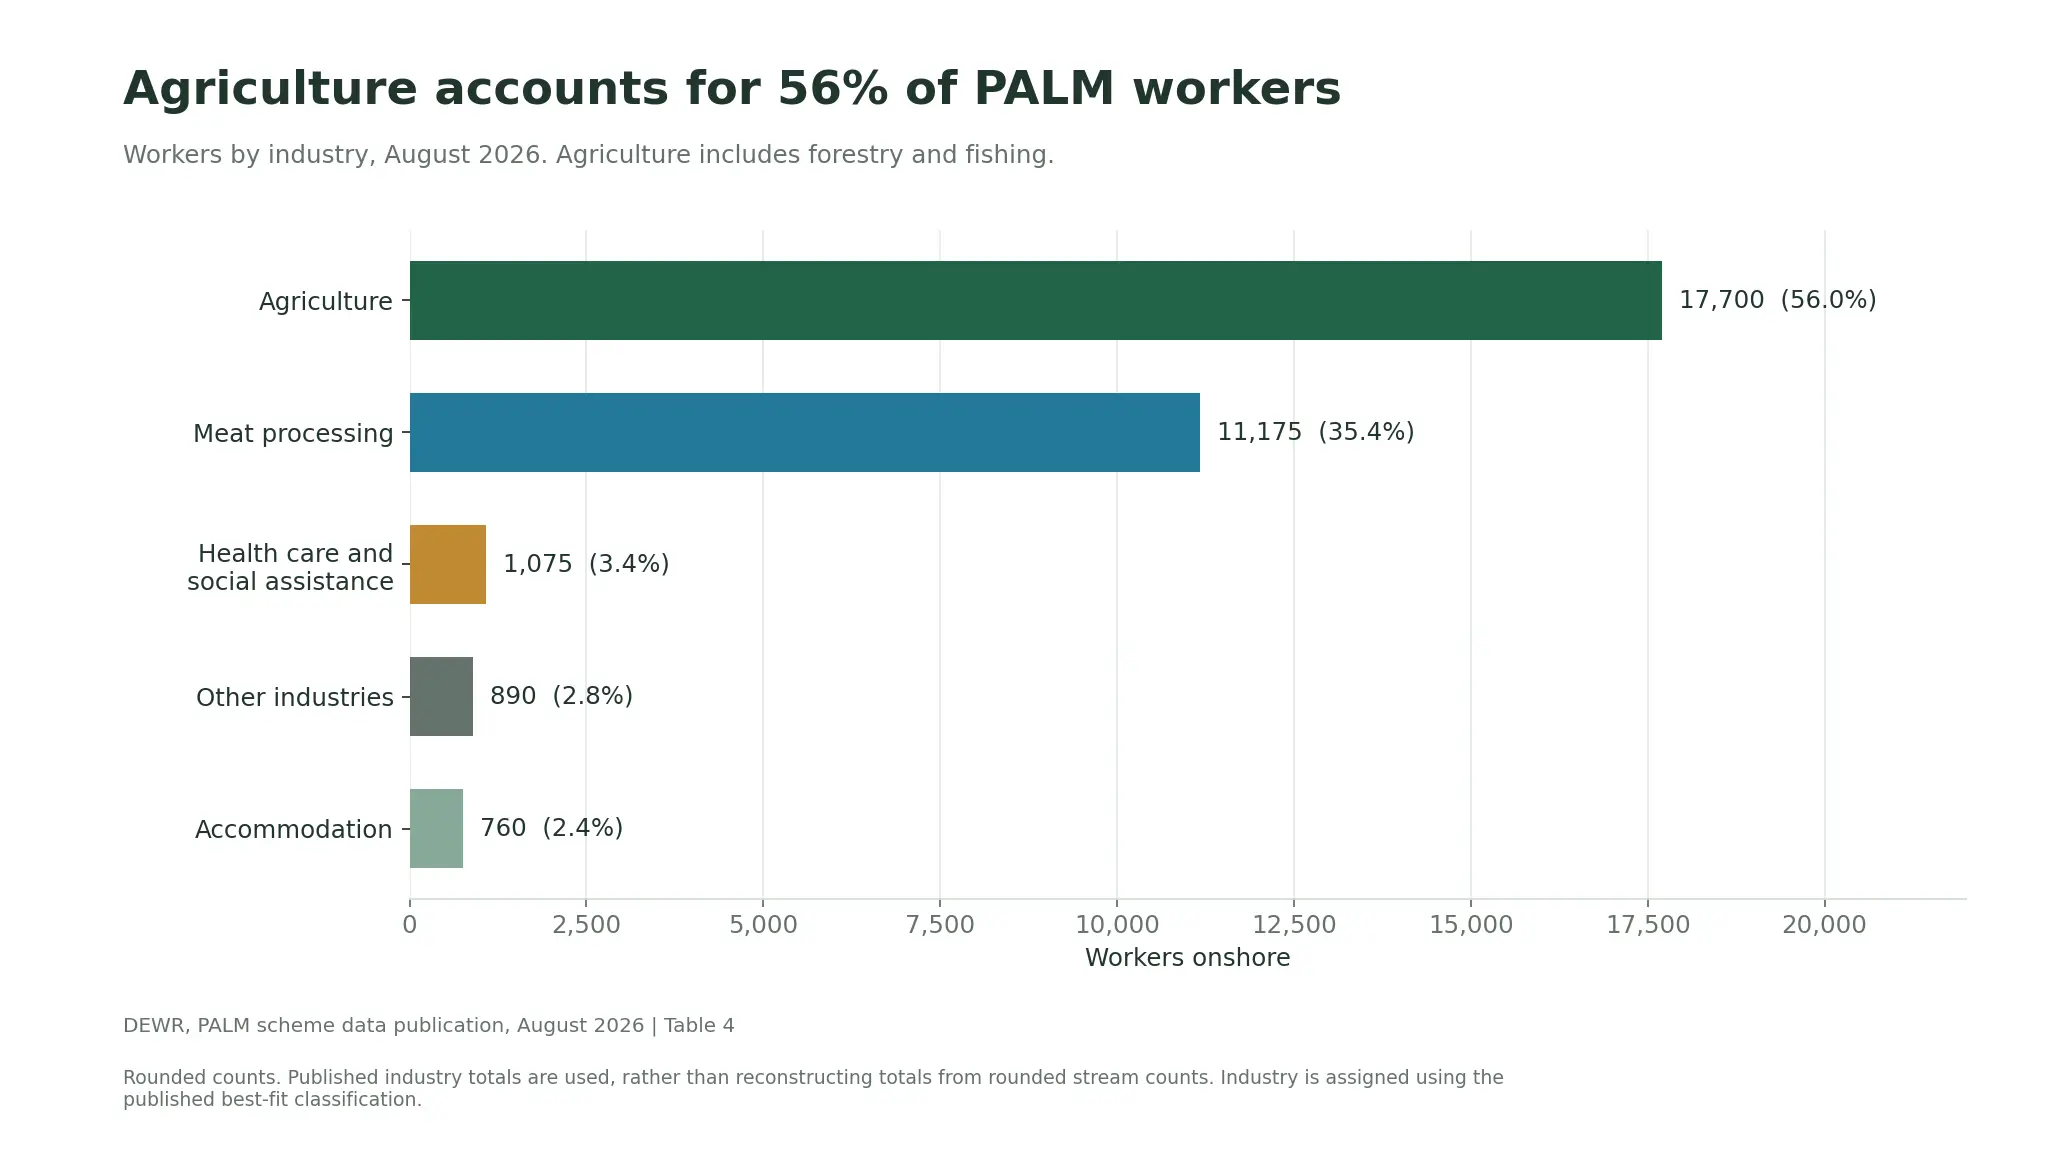
The published agriculture group accounts for 17,700 workers, or approximately 56.0% of the August total. This classification includes forestry and fishing. It is broader than horticulture and cannot be treated as a count of fruit pickers.
Meat processing accounts for 11,175 workers, followed by health care and social assistance with 1,075, other industries with 890 and accommodation with 760. These are best-fit industry classifications in the administrative records, rather than a detailed occupation survey. The workbook’s Accommodation group covers ANZSIC Division H, accommodation and food services, rather than lodging alone.
View the data behind this graph
| Industry | Workers | Share pct |
|---|---|---|
| Agriculture | 17,700 | 56.0 |
| Meat processing | 11,175 | 35.4 |
| Health care and social assistance | 1,075 | 3.4 |
| Other industries | 890 | 2.8 |
| Accommodation | 760 | 2.4 |
The national stream split is almost even
August includes 16,340 long-term workers and 15,260 short-term workers. Long-term participants represent approximately 51.7% of the total. That national balance conceals substantial differences between industries: agriculture has a much larger short-term component, while meat processing has a much larger long-term component.
Our analysis of short-term and long-term PALM participation examines those differences. Use it to understand the composition of the published workforce, then assess a proposed placement against its own requirements.
Turn the figures into a better staffing conversation
A useful enquiry starts with the work: location, tasks, anticipated start and finish, expected hours, required capabilities and supervision. Accommodation and transport need a separate capacity check. A larger national workforce does not establish that a particular crew is uncommitted or that all placement arrangements are ready.
Keep three columns in the planning conversation: what the public data shows, what the business has confirmed, and what still needs checking. For example, “agriculture participation increased annually” belongs in the first column. “Twelve workers confirmed for these dates” belongs in the second only when supported by an actual confirmation.
Read our PALM recruitment timeline guide before setting a proposed start date. The accommodation capacity guide explains why an empty bed alone is not evidence that a placement can proceed.
For the next monthly release, compare the same month a year earlier, review the recent trend and check for revisions. That approach gives a grower more useful context than a headline based on one monthly movement.
Explore the PALM data series
- 17,700 PALM Workers in Agriculture: What the Data Means for Growers
- PALM Workers Across Australia: A State Comparison with a Victorian Focus
- Short-Term and Long-Term PALM: How the Workforce Mix Has Changed
- Ten PALM Country Profiles: Participation, Trends and Stream Mix
- Women in the PALM Scheme: What Participation Data Shows
- 565 Approved Employers: Understanding Direct Employment and Labour Hire
- Why PALM Numbers Rise and Fall: Reading Seasonal Workforce Data
Source and method
Source: DEWR PALM scheme data, August 2026 workbook and June 2026 quarterly report, checked 26 October 2026. Charts and calculations are Orchard Tech’s analysis. Worker counts are privacy-rounded to the nearest five; components may not sum to totals. Employer counts are not rounded. Percentages calculated from rounded counts are approximate.
The views expressed in this report are those of the authors and do not necessarily represent those of DEWR.
About the author
Hari Yellina is Chief Executive Officer at Orchard Tech. His articles cover agricultural workforce planning, labour hire and practical workplace responsibilities.