565 Approved Employers: Understanding Direct Employment and Labour Hire
• Hari Yellina
PALM data series | Data period: August 2026 | Reviewed: 26 October 2026
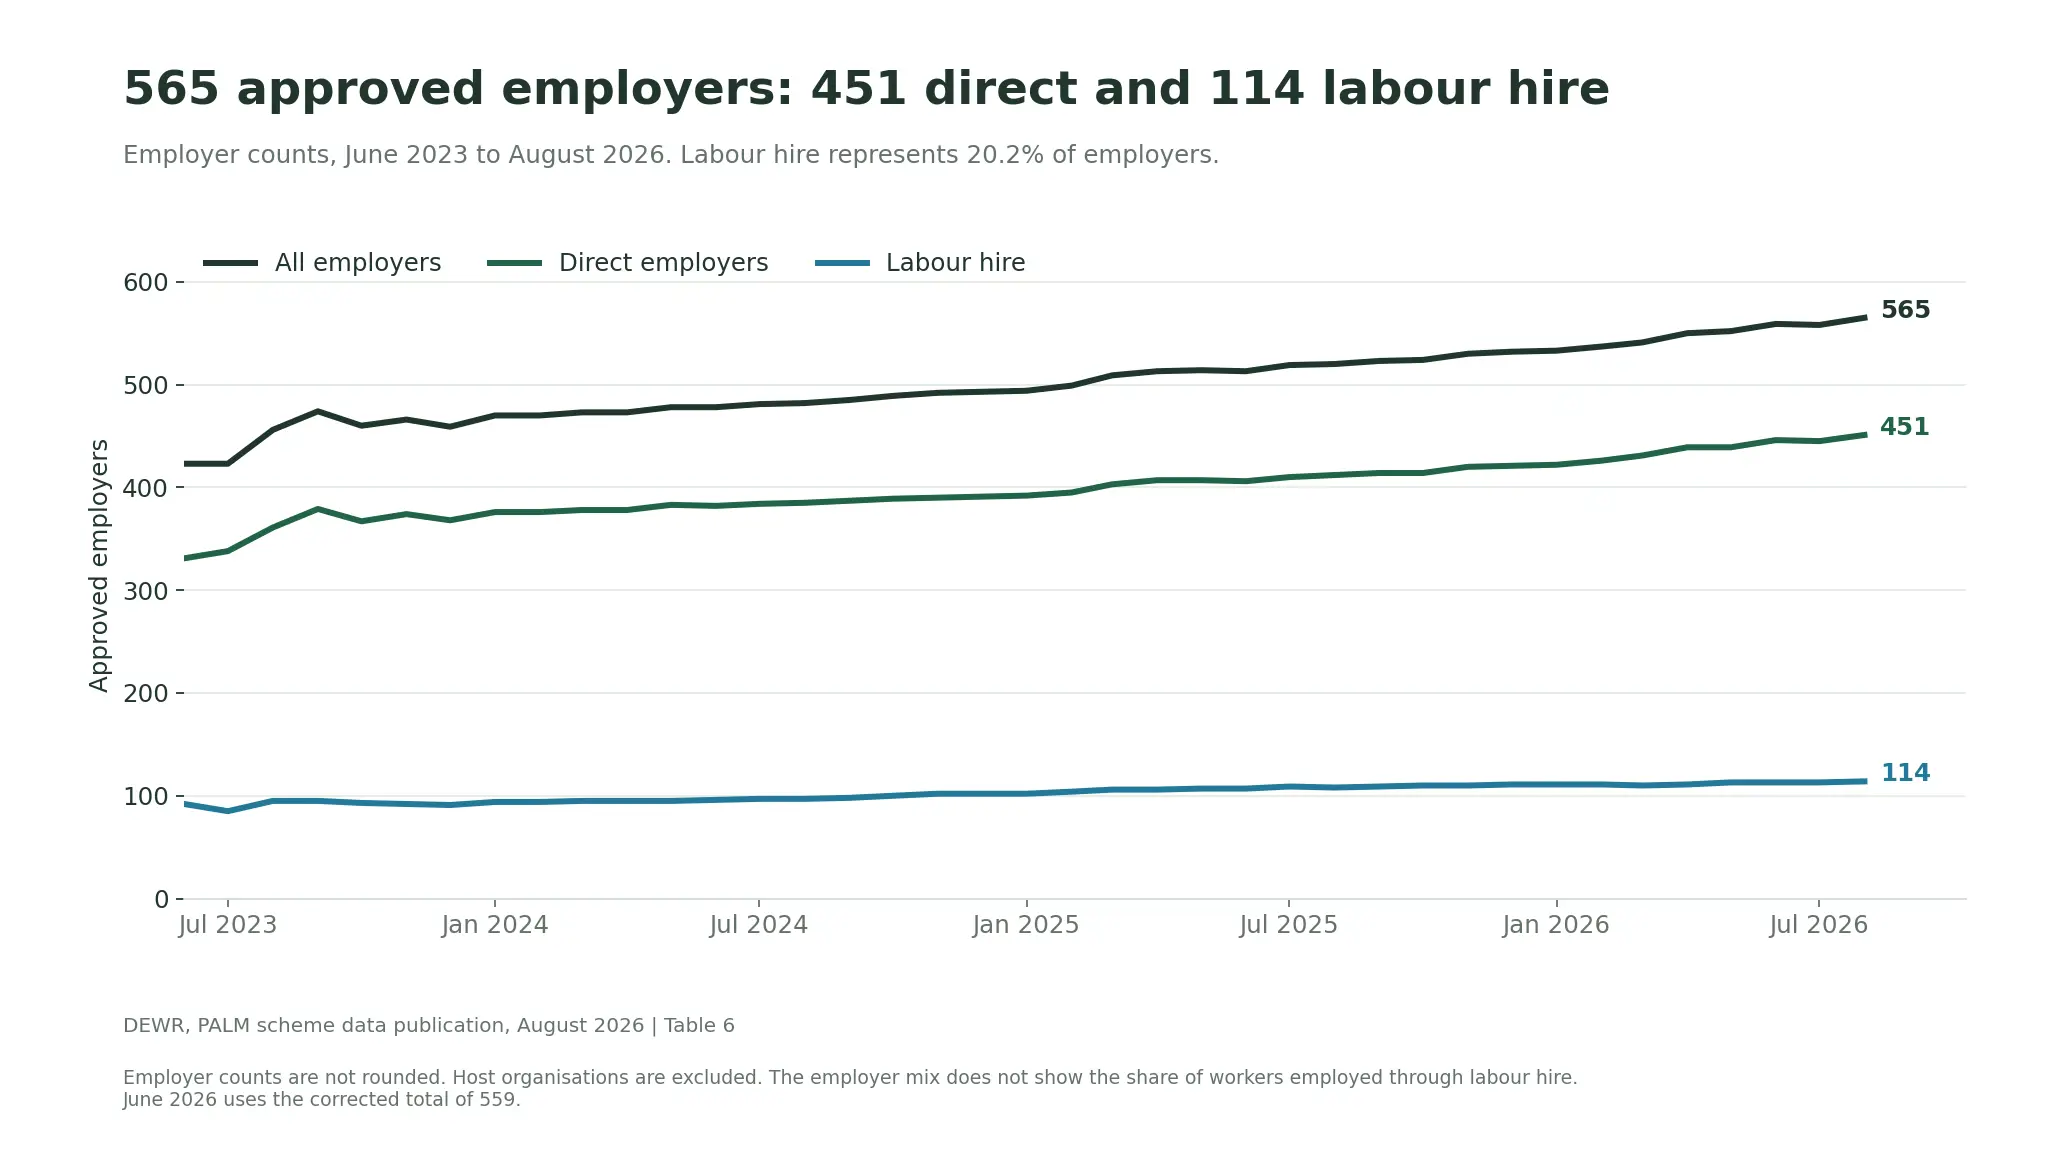
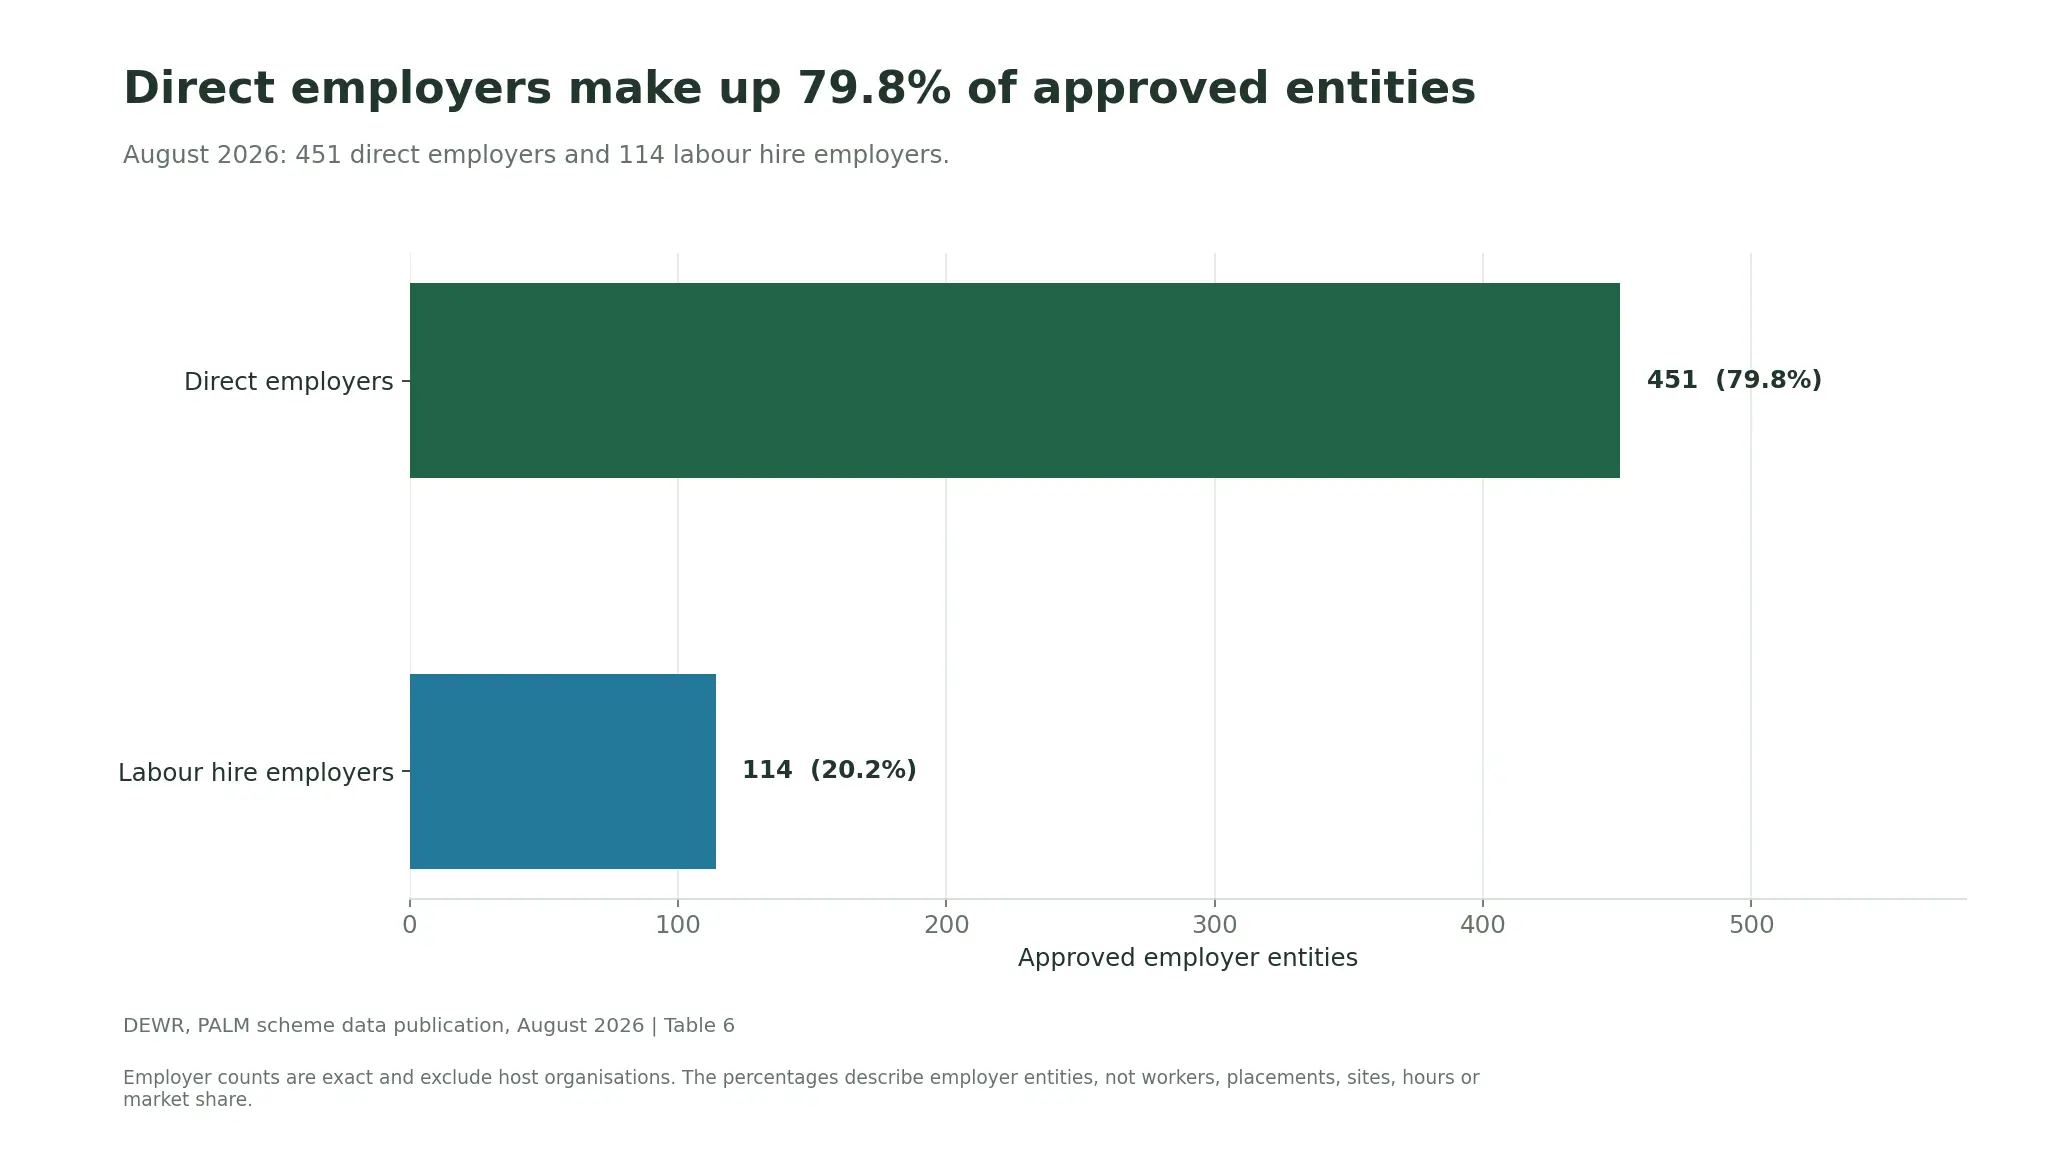
Australia had 565 approved PALM employers in August 2026: 451 direct employers and 114 labour hire employers. That was 45 more approved employers than in August 2025, an increase of approximately 8.7%.
For a grower considering how to arrange workers, the distinction between an approved employer and a host business is useful. The data describes approved entities. It does not count every farm using PALM labour or show how workers are divided between providers.
What is included in the employer count?
The publication counts approved employer entities holding a deed with the department. It counts the employer rather than the number of deeds. Host organisations are excluded from this series, so a host farm does not become a separate approved employer in the data simply because PALM workers are placed there.
The direct-employer and labour-hire categories describe different employment arrangements. They should not be treated as a complete map of worksites or as a measure of how many people each employer has placed.
The number of approved entities has increased
The current workbook records 423 approved employers in June 2023, comprising 331 direct employers and 92 labour hire employers. By August 2026, the corresponding counts were 565, 451 and 114.
Over the latest August-to-August comparison, direct employers increased from 412 to 451, while labour hire employers increased from 108 to 114. These are exact published employer counts; the worker rounding rule does not apply to them.
View the data behind this graph
| Month | Total | Direct | Labour hire |
|---|---|---|---|
| 2023-06 | 423 | 331 | 92 |
| 2023-07 | 423 | 338 | 85 |
| 2023-08 | 456 | 361 | 95 |
| 2023-09 | 474 | 379 | 95 |
| 2023-10 | 460 | 367 | 93 |
| 2023-11 | 466 | 374 | 92 |
| 2023-12 | 459 | 368 | 91 |
| 2024-01 | 470 | 376 | 94 |
| 2024-02 | 470 | 376 | 94 |
| 2024-03 | 473 | 378 | 95 |
| 2024-04 | 473 | 378 | 95 |
| 2024-05 | 478 | 383 | 95 |
| 2024-06 | 478 | 382 | 96 |
| 2024-07 | 481 | 384 | 97 |
| 2024-08 | 482 | 385 | 97 |
| 2024-09 | 485 | 387 | 98 |
| 2024-10 | 489 | 389 | 100 |
| 2024-11 | 492 | 390 | 102 |
| 2024-12 | 493 | 391 | 102 |
| 2025-01 | 494 | 392 | 102 |
| 2025-02 | 499 | 395 | 104 |
| 2025-03 | 509 | 403 | 106 |
| 2025-04 | 513 | 407 | 106 |
| 2025-05 | 514 | 407 | 107 |
| 2025-06 | 513 | 406 | 107 |
| 2025-07 | 519 | 410 | 109 |
| 2025-08 | 520 | 412 | 108 |
| 2025-09 | 523 | 414 | 109 |
| 2025-10 | 524 | 414 | 110 |
| 2025-11 | 530 | 420 | 110 |
| 2025-12 | 532 | 421 | 111 |
| 2026-01 | 533 | 422 | 111 |
| 2026-02 | 537 | 426 | 111 |
| 2026-03 | 541 | 431 | 110 |
| 2026-04 | 550 | 439 | 111 |
| 2026-05 | 552 | 439 | 113 |
| 2026-06 | 559 | 446 | 113 |
| 2026-07 | 558 | 445 | 113 |
| 2026-08 | 565 | 451 | 114 |
Use the corrected June figure
The June 2026 quarterly report contains both 556 and 559 as its employer total. The later August workbook explicitly records a correction: June’s total is 559, following a delay in data updates. The graph uses the corrected historical series consistently.
This is a useful reminder when preparing a presentation. A number copied from an earlier report may have been revised. Keep the source edition and reporting month with the figure, and use one publication version for both sides of a comparison where possible.
Labour hire represents 20.2% of employer entities
The 114 labour hire employers account for approximately 20.2% of the 565 approved entities. Direct employers account for approximately 79.8%.
These percentages do not mean that labour hire employs 20.2% of PALM workers. The workbook does not provide worker counts split by direct and labour hire employer type. An employer with a small workforce and one with a much larger workforce each contribute one entity to this count.
View the data behind this graph
| Type | Employers | Share pct |
|---|---|---|
| Direct employers | 451 | 79.8 |
| Labour hire employers | 114 | 20.2 |
Ask questions about the proposed arrangement
When considering a workforce proposal, first establish who would employ the workers and which business would host the work. Then identify who will coordinate the proposed placement, day-to-day supervision, accommodation, transport and communication.
Record the responsibilities clearly enough that a grower and provider can identify the next action. A count of approved employers cannot verify a particular business’s current approval, licence status, capacity or proposed arrangements. Those checks need current evidence for the entity concerned.
Keep commercial comparisons grounded in what is actually being offered: tasks, location, dates, expected hours, support and confirmed availability. The national number of approved employers does not demonstrate a price trend, service quality or the availability of workers in a region.
Connect the employer discussion with practical capacity
Our recruitment timeline guide explains why the intended start date needs an early discussion. The accommodation capacity guide helps separate a proposed crew from the supporting arrangements required to make it workable.
Use the employer figures to understand the structure of the scheme, and the national workforce overview to understand participation. Keep those two measures separate when discussing the role of labour hire.
Explore the PALM data series
- PALM Scheme in August 2026: The Numbers Behind the Workforce
- 17,700 PALM Workers in Agriculture: What the Data Means for Growers
- PALM Workers Across Australia: A State Comparison with a Victorian Focus
- Short-Term and Long-Term PALM: How the Workforce Mix Has Changed
- Ten PALM Country Profiles: Participation, Trends and Stream Mix
- Women in the PALM Scheme: What Participation Data Shows
- Why PALM Numbers Rise and Fall: Reading Seasonal Workforce Data
Source and method
Source: DEWR PALM scheme data, August 2026 workbook and June 2026 quarterly report, checked 26 October 2026. Charts and calculations are Orchard Tech’s analysis. Worker counts are privacy-rounded to the nearest five; components may not sum to totals. Employer counts are not rounded. Percentages calculated from rounded counts are approximate.
The views expressed in this report are those of the authors and do not necessarily represent those of DEWR.
About the author
Hari Yellina is Chief Executive Officer at Orchard Tech. His articles cover agricultural workforce planning, labour hire and practical workplace responsibilities.