Why PALM Numbers Rise and Fall: Reading Seasonal Workforce Data
• Hari Yellina
PALM data series | Data period: August 2026 | Reviewed: 26 October 2026
A fall in the monthly PALM count does not by itself establish a lasting contraction in the workforce. A rise does not establish that more people are available for a particular farm. The useful question is what changed, over which period, and within what statistical definition.
August 2026 provides a clear example. The national count fell from 31,840 in July to 31,600 in August, approximately 0.8%. Compared with August 2025, however, participation was approximately 4.6% higher. Both statements describe the same release accurately.
Begin with a matching-month comparison
Comparing August with the previous August places the observations at a similar point in the calendar. It does not remove every influence, but it avoids treating a routine seasonal difference between adjacent months as the whole story.
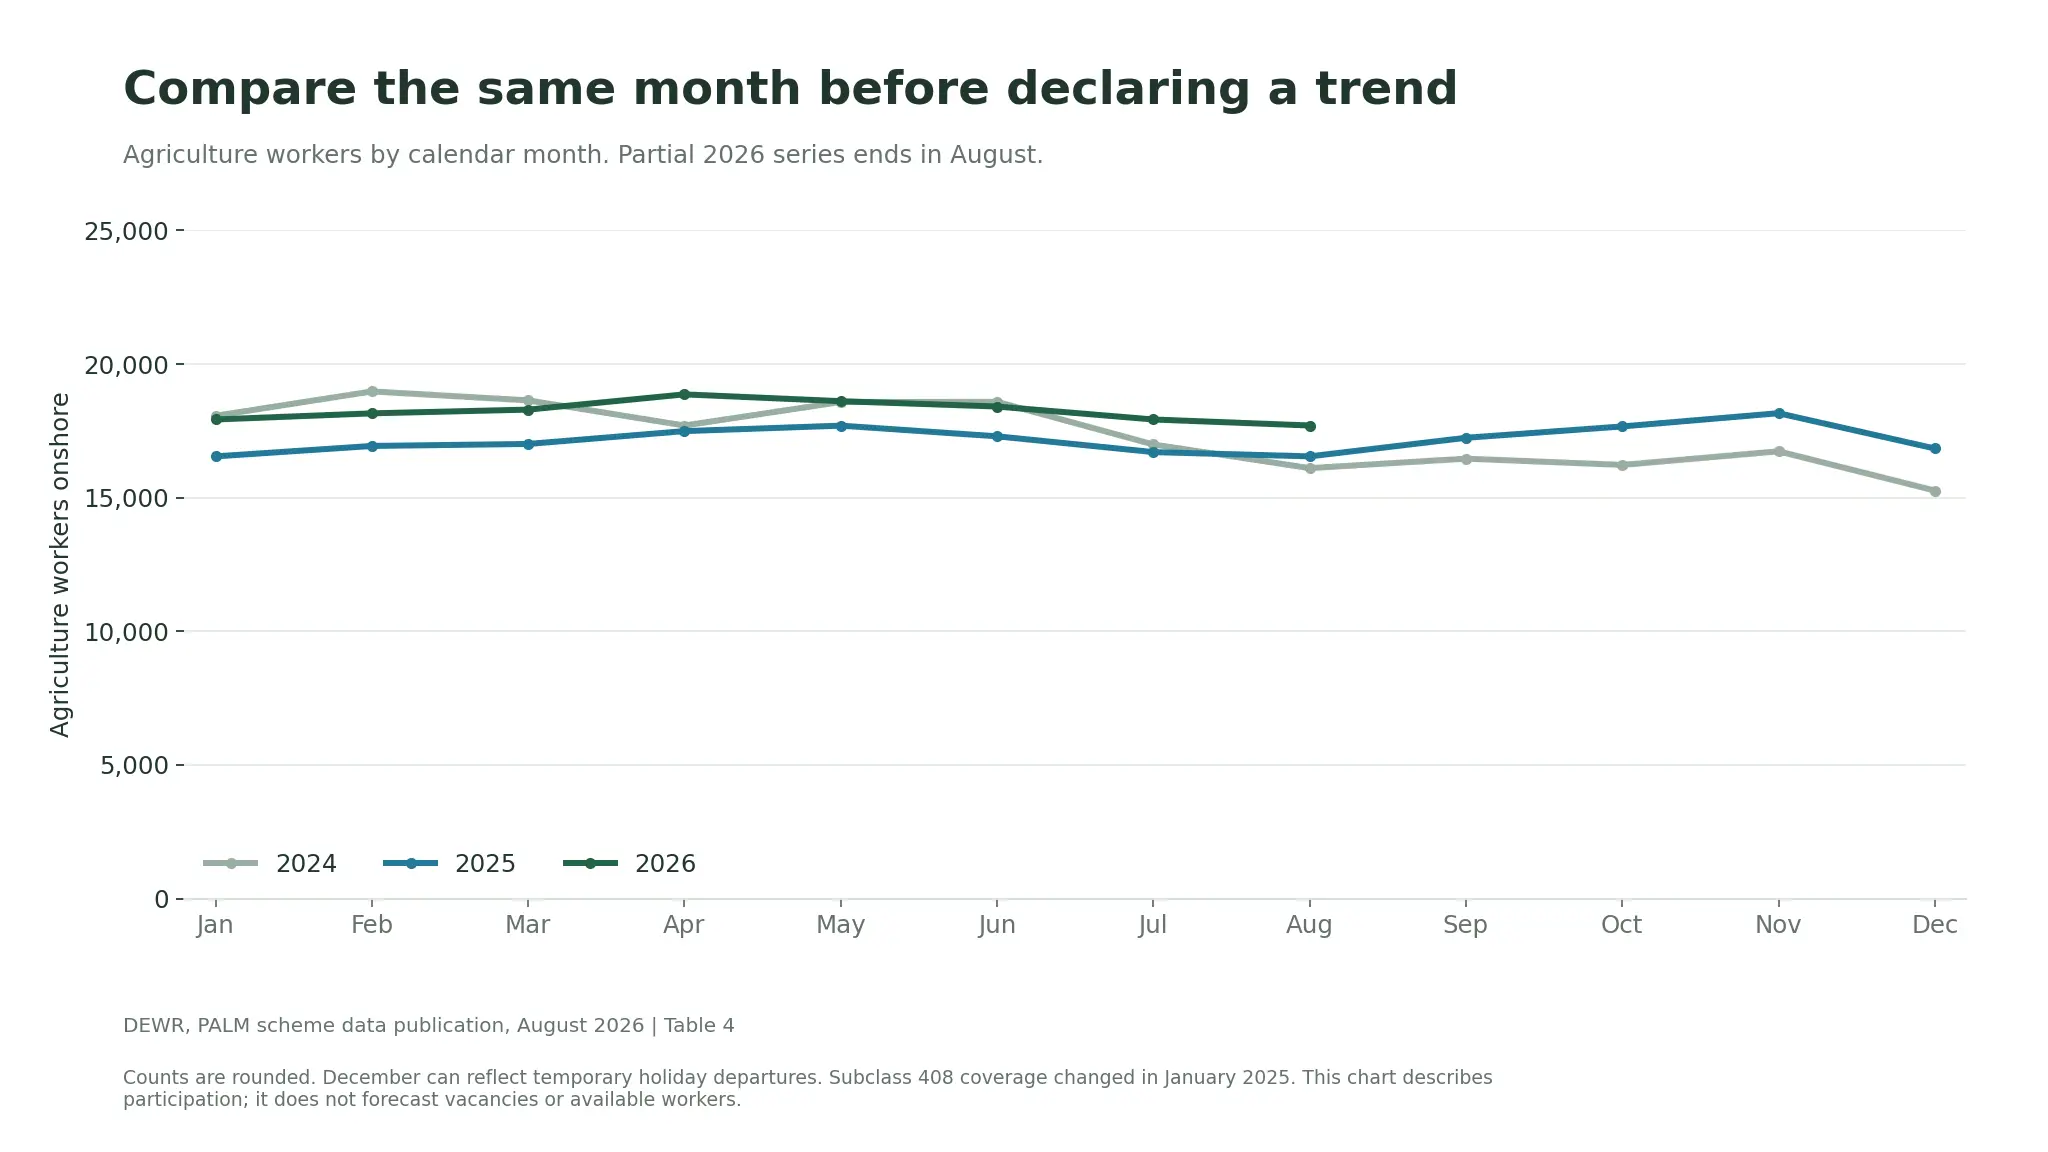
In agriculture, the published count was 17,700 in August 2026, compared with 16,545 in August 2025 and 16,105 in August 2024. The calendar graph helps a reader compare the paths, while showing that the 2026 series is only available to August.
View the data behind this graph
| Month | Workers |
|---|---|
| 2024-01 | 18,065 |
| 2024-02 | 18,975 |
| 2024-03 | 18,640 |
| 2024-04 | 17,700 |
| 2024-05 | 18,580 |
| 2024-06 | 18,585 |
| 2024-07 | 16,990 |
| 2024-08 | 16,105 |
| 2024-09 | 16,460 |
| 2024-10 | 16,225 |
| 2024-11 | 16,735 |
| 2024-12 | 15,265 |
| 2025-01 | 16,545 |
| 2025-02 | 16,935 |
| 2025-03 | 17,010 |
| 2025-04 | 17,490 |
| 2025-05 | 17,695 |
| 2025-06 | 17,295 |
| 2025-07 | 16,705 |
| 2025-08 | 16,545 |
| 2025-09 | 17,240 |
| 2025-10 | 17,665 |
| 2025-11 | 18,160 |
| 2025-12 | 16,840 |
| 2026-01 | 17,925 |
| 2026-02 | 18,155 |
| 2026-03 | 18,295 |
| 2026-04 | 18,865 |
| 2026-05 | 18,610 |
| 2026-06 | 18,410 |
| 2026-07 | 17,925 |
| 2026-08 | 17,700 |
The agriculture group includes forestry and fishing. The graph is therefore not a harvest calendar for a particular crop. It also crosses a national coverage change in January 2025, which needs to remain visible in the source note.
December illustrates why the calendar matters
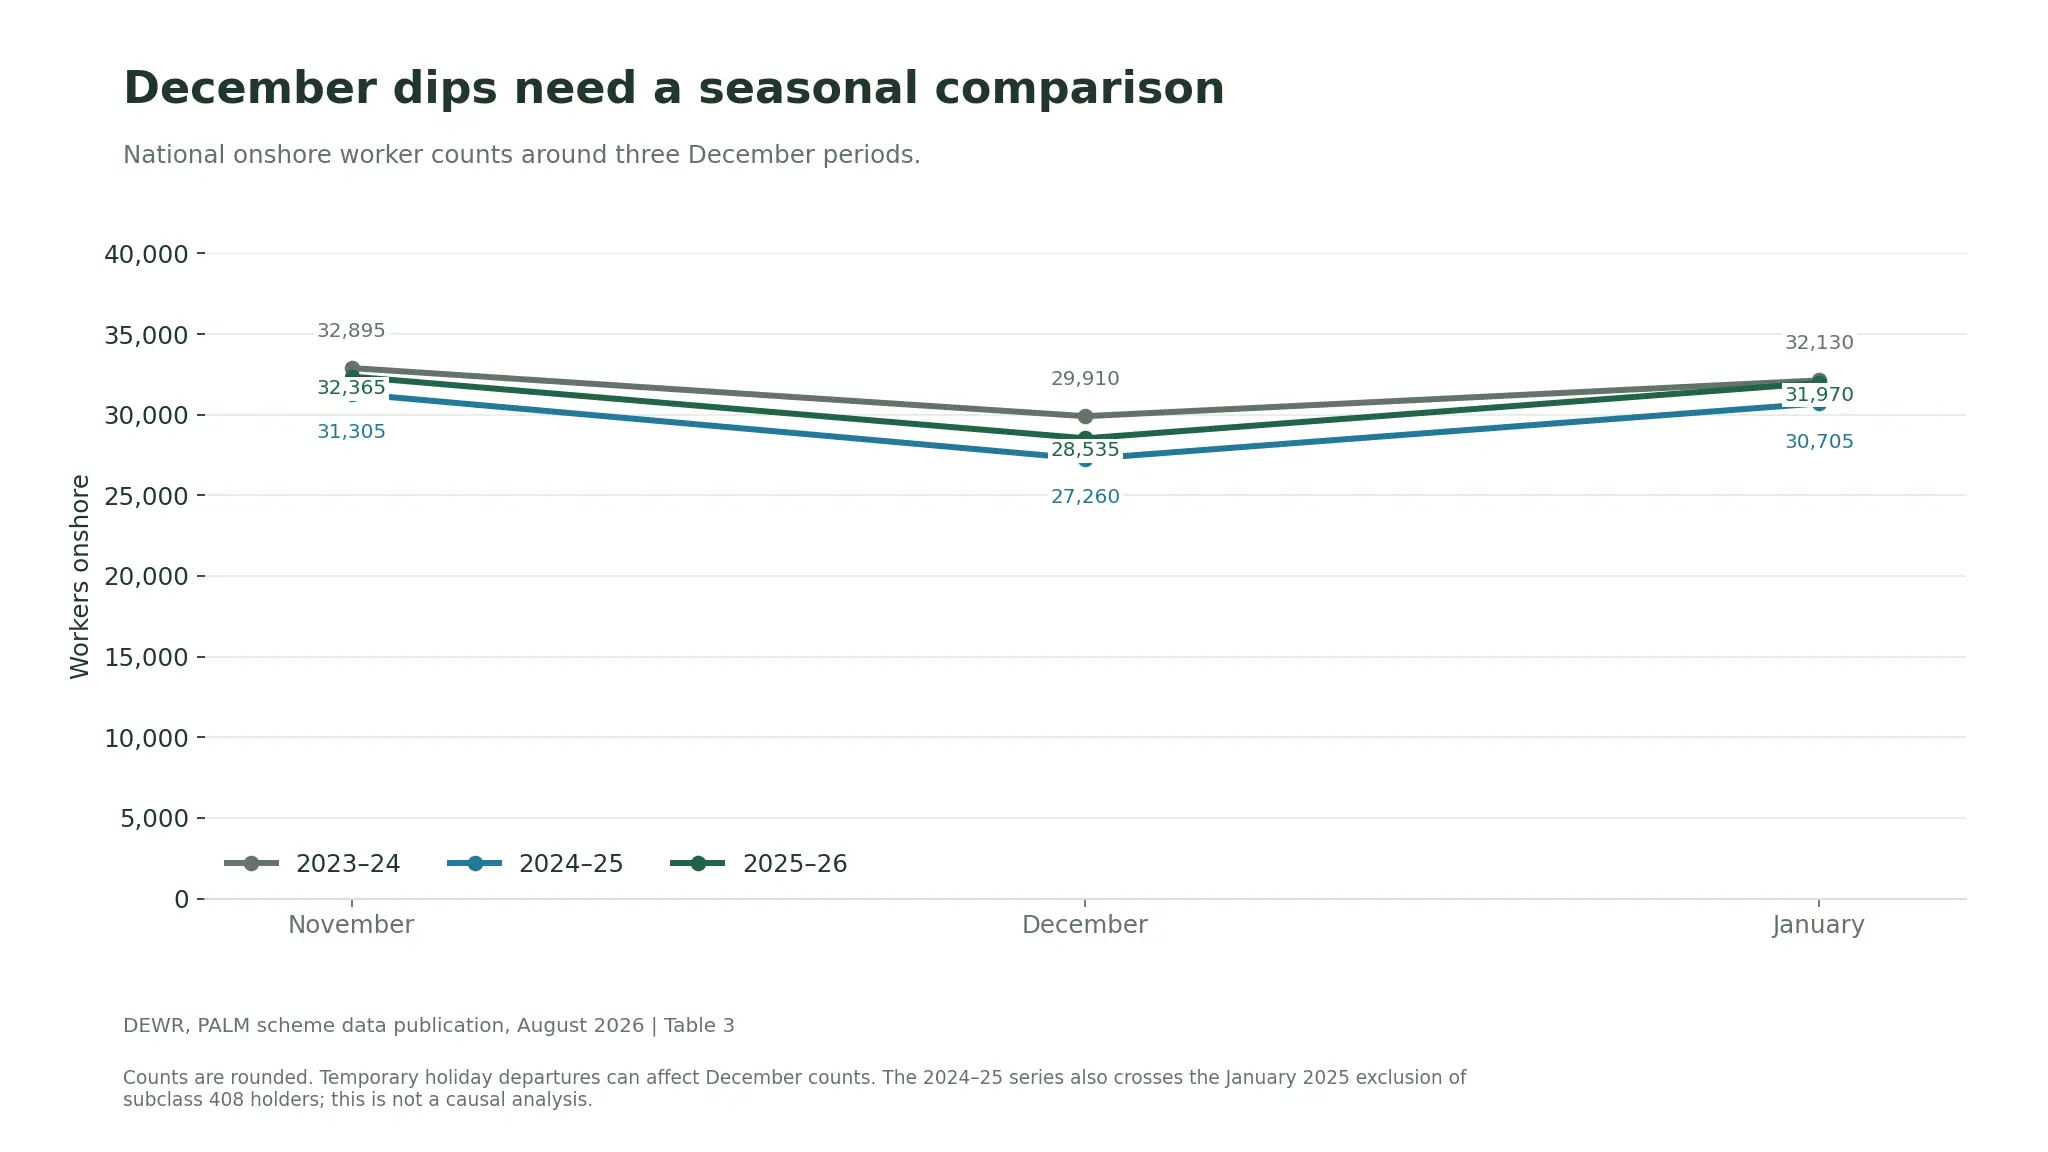
The national total fell from 32,365 in November 2025 to 28,535 in December, then rose to 31,970 in January 2026. Similar December dips appear in the two earlier periods shown below.
DEWR warns that temporary returns home for holidays can affect participation. Because the dataset counts workers onshore, an offshore period can change the total even when it does not represent a permanent exit from the scheme. The chart alone cannot determine the reason for each person’s absence or return.
View the data behind this graph
| Month | Workers |
|---|---|
| 2023-11 | 32,895 |
| 2023-12 | 29,910 |
| 2024-01 | 32,130 |
| 2024-11 | 31,305 |
| 2024-12 | 27,260 |
| 2025-01 | 30,705 |
| 2025-11 | 32,365 |
| 2025-12 | 28,535 |
| 2026-01 | 31,970 |
Check for changes in coverage and revisions
Relevant subclass 408 visa holders are included in historical national data where possible up to December 2024. They are excluded from January 2025. That means the 2024–25 December-to-January comparison spans a change in scope as well as the holiday period.
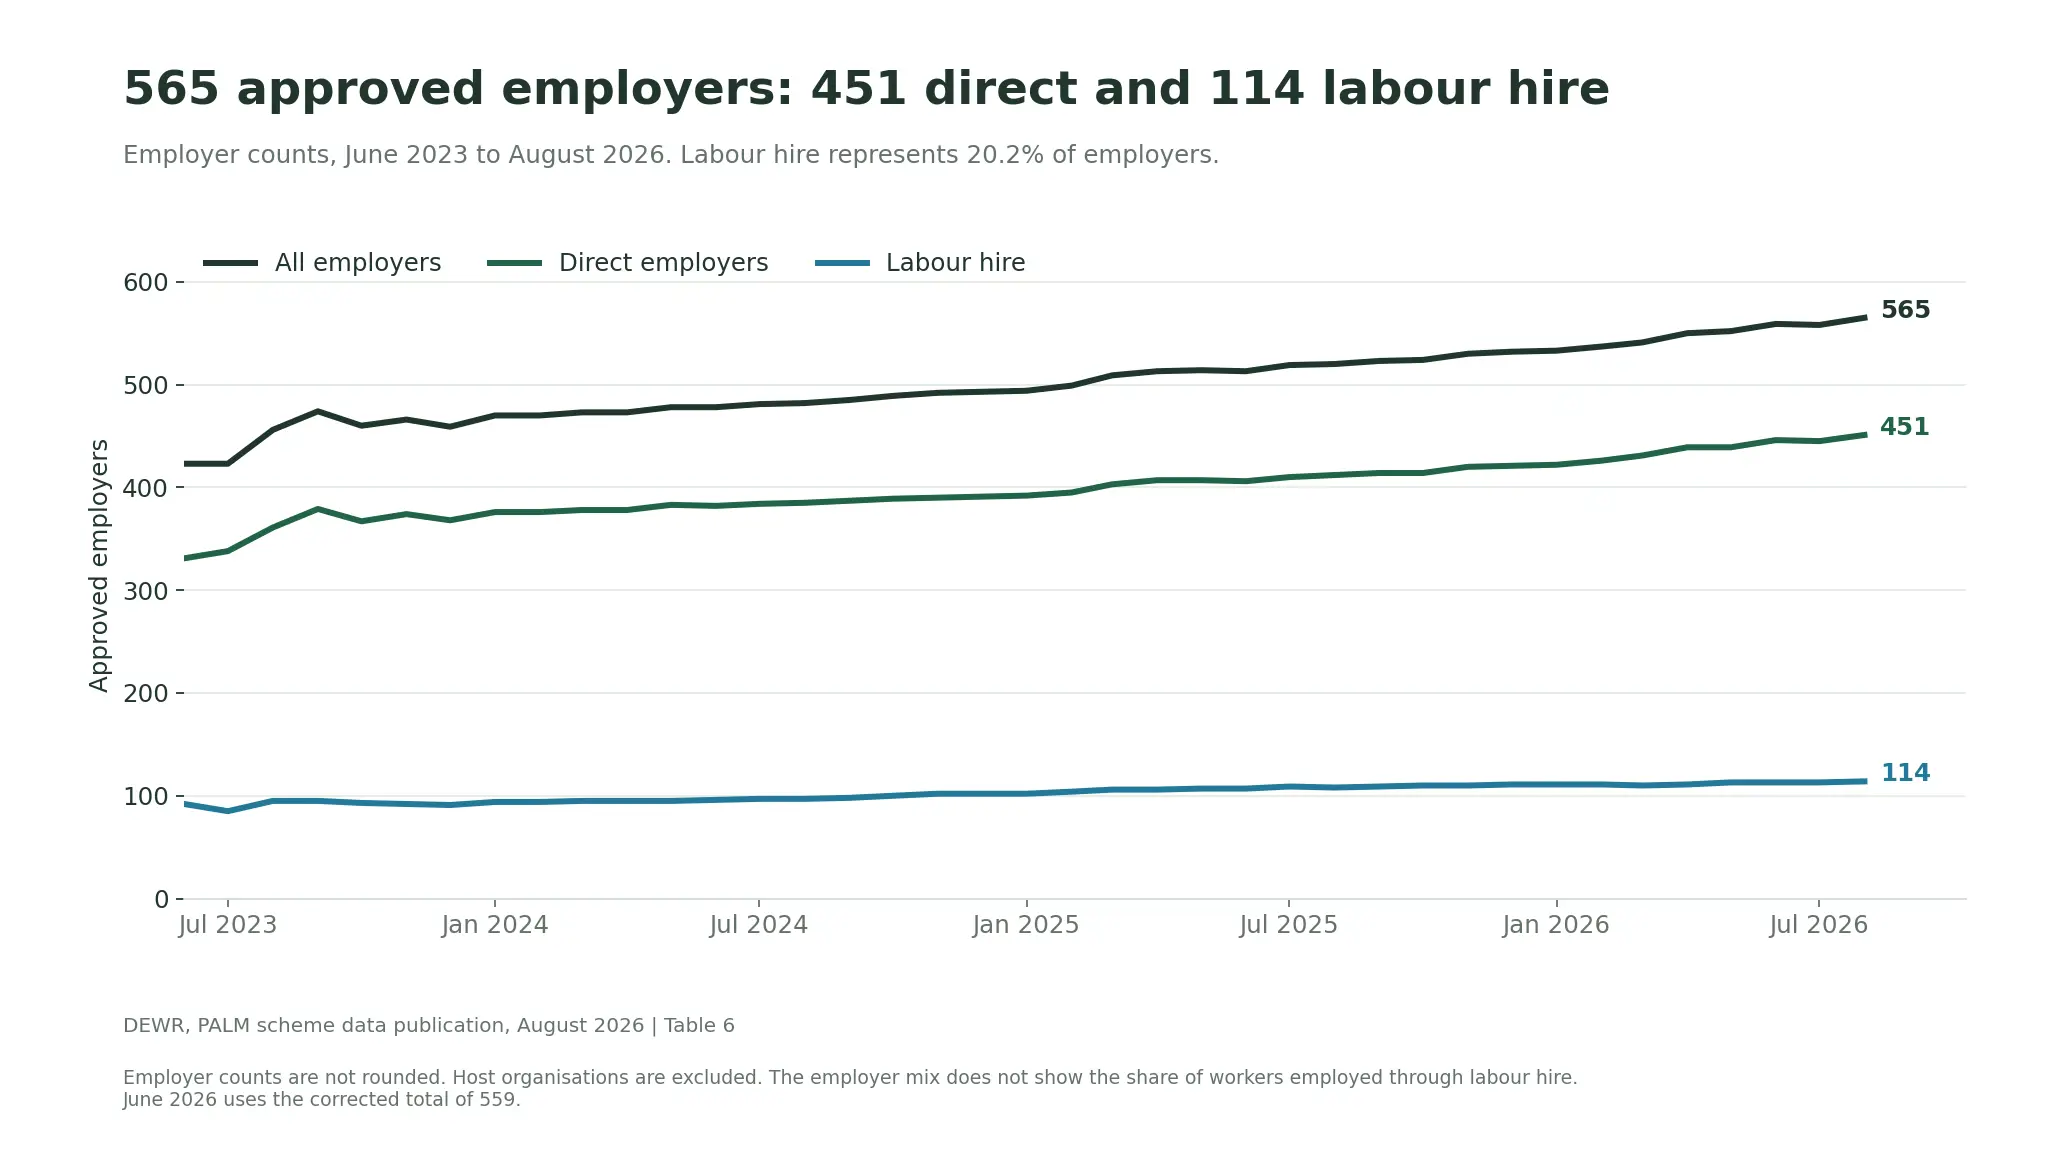
The latest workbook also contains revised historical values. For example, June 2026’s approved-employer count is corrected to 559. A sound comparison uses the same current source edition rather than mixing a newly downloaded value with a number copied months earlier.
State data has its own coverage notes and does not include subclass 408 holders in the historical state breakdown. Do not assume a sum of older state observations must match a national total with different coverage.
Do not add monthly stocks into an annual total
These observations count participants at particular points in time. The same person can appear in several monthly observations. Adding the months would not reveal how many unique people participated during the year, how many arrived, or how many jobs were filled.
Similarly, a change of 1,385 between August 2025 and August 2026 is the difference between two counts. It is not evidence that exactly 1,385 people arrived during that period. Arrivals, departures and other changes would need separate flow data.
A five-step check before using a headline
- Name the measure. Is it workers onshore, a participation share or approved employer entities?
- Name the period. Keep the observation month separate from the article’s publication date.
- Compare consistently. Show a matching-month annual comparison alongside the recent movement.
- Read the notes. Check rounding, coverage, location proxies and historical revisions.
- Return to the business evidence. Confirm actual work, people, dates and support arrangements before making a staffing commitment.
This routine makes a graph useful in a grower discussion without asking it to answer questions it cannot resolve. Read the agriculture analysis and the state comparison for examples of applying it to different parts of the dataset.
Explore the PALM data series
- PALM Scheme in August 2026: The Numbers Behind the Workforce
- 17,700 PALM Workers in Agriculture: What the Data Means for Growers
- PALM Workers Across Australia: A State Comparison with a Victorian Focus
- Short-Term and Long-Term PALM: How the Workforce Mix Has Changed
- Ten PALM Country Profiles: Participation, Trends and Stream Mix
- Women in the PALM Scheme: What Participation Data Shows
- 565 Approved Employers: Understanding Direct Employment and Labour Hire
Source and method
Source: DEWR PALM scheme data, August 2026 workbook and June 2026 quarterly report, checked 26 October 2026. Charts and calculations are Orchard Tech’s analysis. Worker counts are privacy-rounded to the nearest five; components may not sum to totals. Employer counts are not rounded. Percentages calculated from rounded counts are approximate.
The views expressed in this report are those of the authors and do not necessarily represent those of DEWR.
About the author
Hari Yellina is Chief Executive Officer at Orchard Tech. His articles cover agricultural workforce planning, labour hire and practical workplace responsibilities.