17,700 PALM Workers in Agriculture: What the Data Means for Growers
• Hari Yellina
PALM data series | Data period: August 2026 | Reviewed: 26 October 2026
Agriculture accounted for 17,700 PALM workers in August 2026, approximately 56% of all scheme participants onshore. The count was 1,155 higher than in August 2025, an increase of about 7.0%. For growers, this establishes agriculture’s scale within the scheme. It does not establish the availability of a crew for the next harvest.
The most useful reading combines three questions: what the agriculture category contains, how the count changes through the year, and how the employment streams differ from other industries.
What does “agriculture” cover?
The publication’s agriculture classification includes forestry and fishing. It is not a horticulture-only total, and the workbook does not separate apples, cherries, table grapes or other crops. It also does not provide a state-by-industry table that could turn the national figure into a count of Victorian horticulture workers.
These limits matter in practical discussions. A statement that 17,700 people participate in the agriculture group is supported. A statement that 17,700 fruit pickers are available for recruitment is not. Some participants are already committed to existing work, and the dataset does not publish individual availability.
Compare matching months before drawing a conclusion
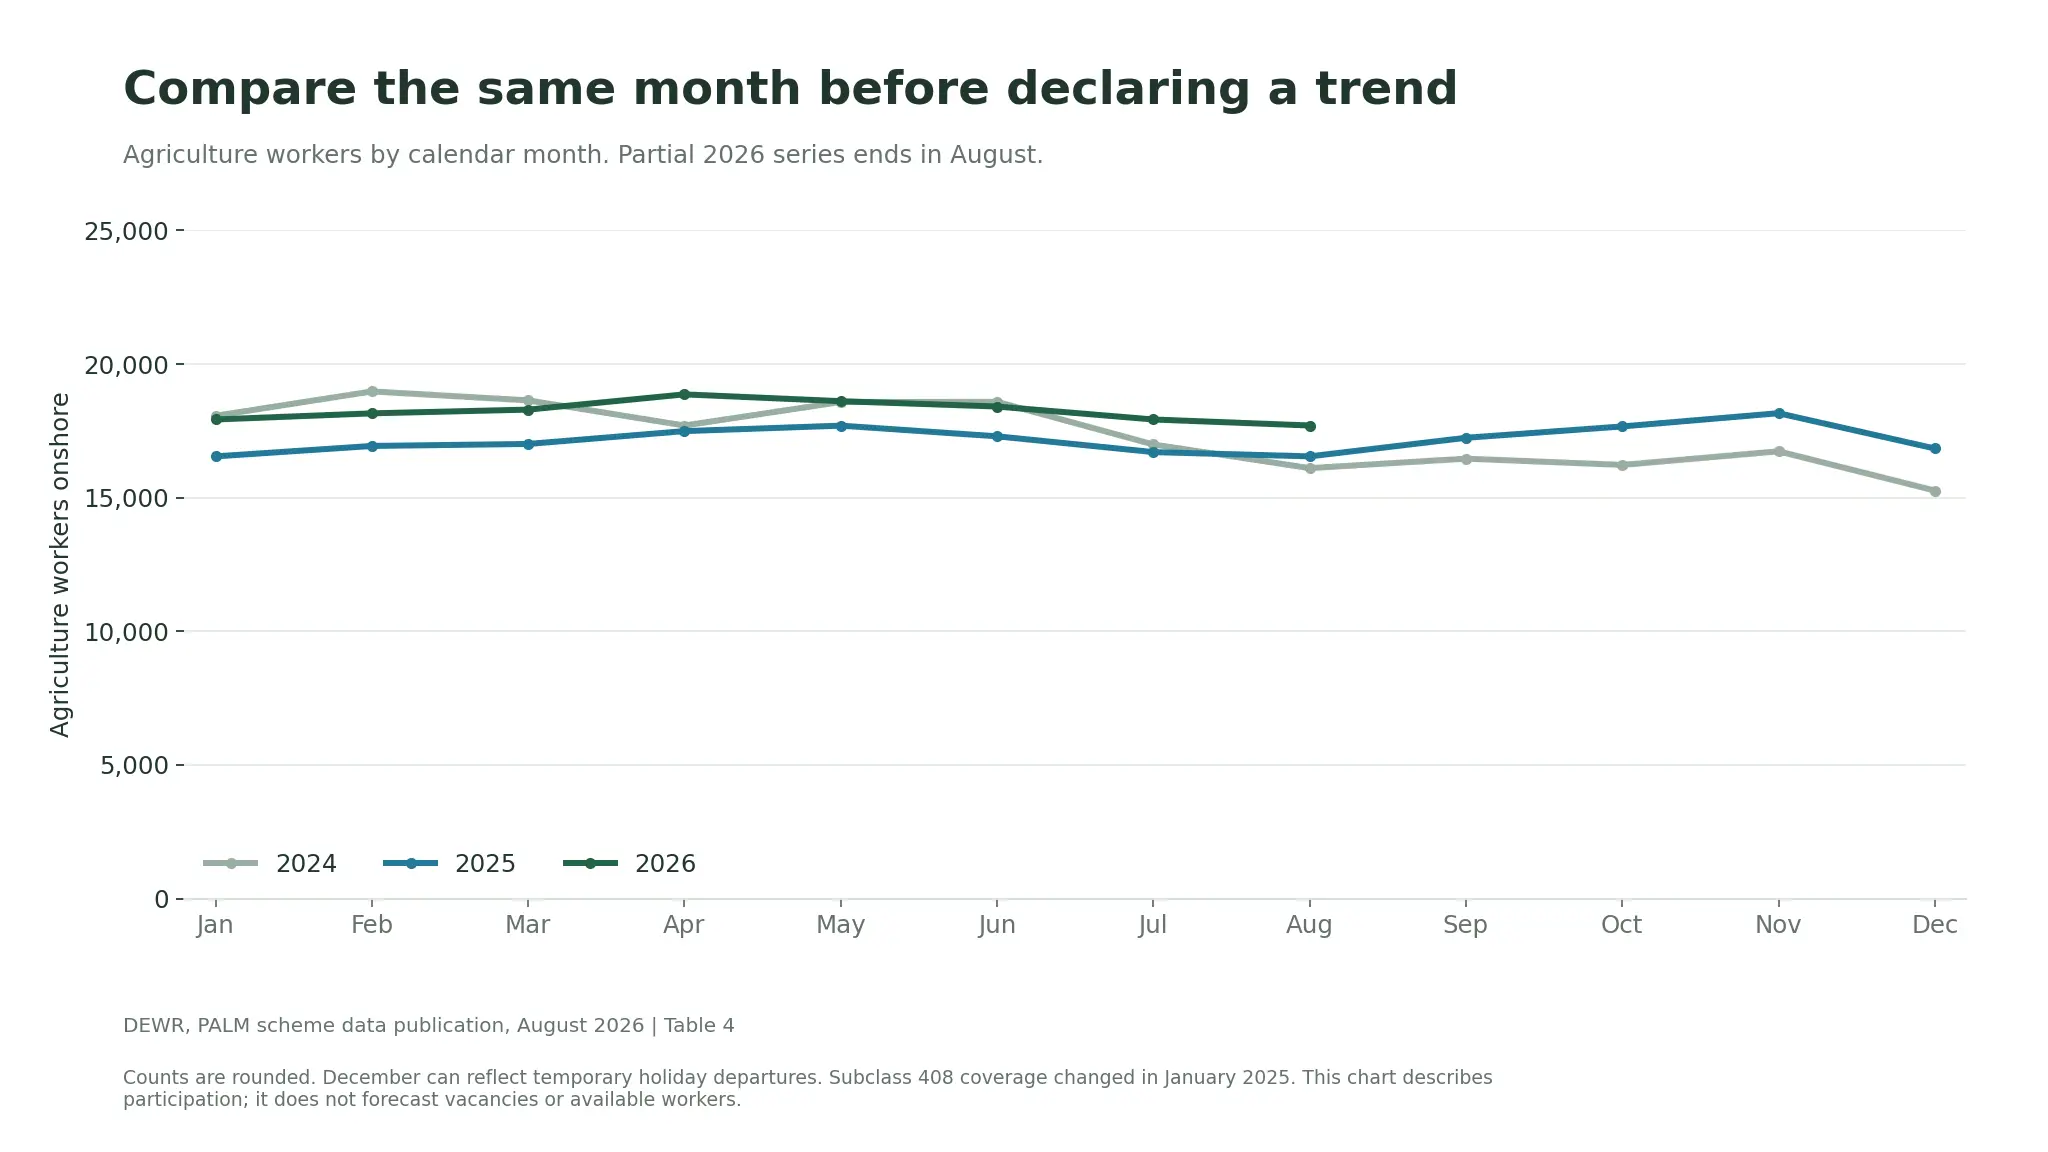
Agriculture’s count was 17,925 in July 2026 and 17,700 in August, a reduction of 225. At the same time, the August figure was above the 16,545 recorded a year earlier. A monthly decline and an annual increase can both be true.
The calendar comparison below places the months alongside previous years. The 2026 line stops in August because later observations were not available at review. It is not a forecast for the spring or summer harvest.
View the data behind this graph
| Month | Workers |
|---|---|
| 2024-01 | 18,065 |
| 2024-02 | 18,975 |
| 2024-03 | 18,640 |
| 2024-04 | 17,700 |
| 2024-05 | 18,580 |
| 2024-06 | 18,585 |
| 2024-07 | 16,990 |
| 2024-08 | 16,105 |
| 2024-09 | 16,460 |
| 2024-10 | 16,225 |
| 2024-11 | 16,735 |
| 2024-12 | 15,265 |
| 2025-01 | 16,545 |
| 2025-02 | 16,935 |
| 2025-03 | 17,010 |
| 2025-04 | 17,490 |
| 2025-05 | 17,695 |
| 2025-06 | 17,295 |
| 2025-07 | 16,705 |
| 2025-08 | 16,545 |
| 2025-09 | 17,240 |
| 2025-10 | 17,665 |
| 2025-11 | 18,160 |
| 2025-12 | 16,840 |
| 2026-01 | 17,925 |
| 2026-02 | 18,155 |
| 2026-03 | 18,295 |
| 2026-04 | 18,865 |
| 2026-05 | 18,610 |
| 2026-06 | 18,410 |
| 2026-07 | 17,925 |
| 2026-08 | 17,700 |
The lines reflect participation across a broad industry group, with a coverage break: relevant subclass 408 visa holders are excluded from January 2025. Comparisons across that boundary can reflect both workforce movements and the change in who is counted. They do not measure one crop’s labour demand, the severity of a shortage, or the reason workers entered or left the count. Weather, crop timing or recruitment decisions may be relevant questions for a particular business, but this dataset alone cannot identify their effects.
Agriculture has a substantial short-term component
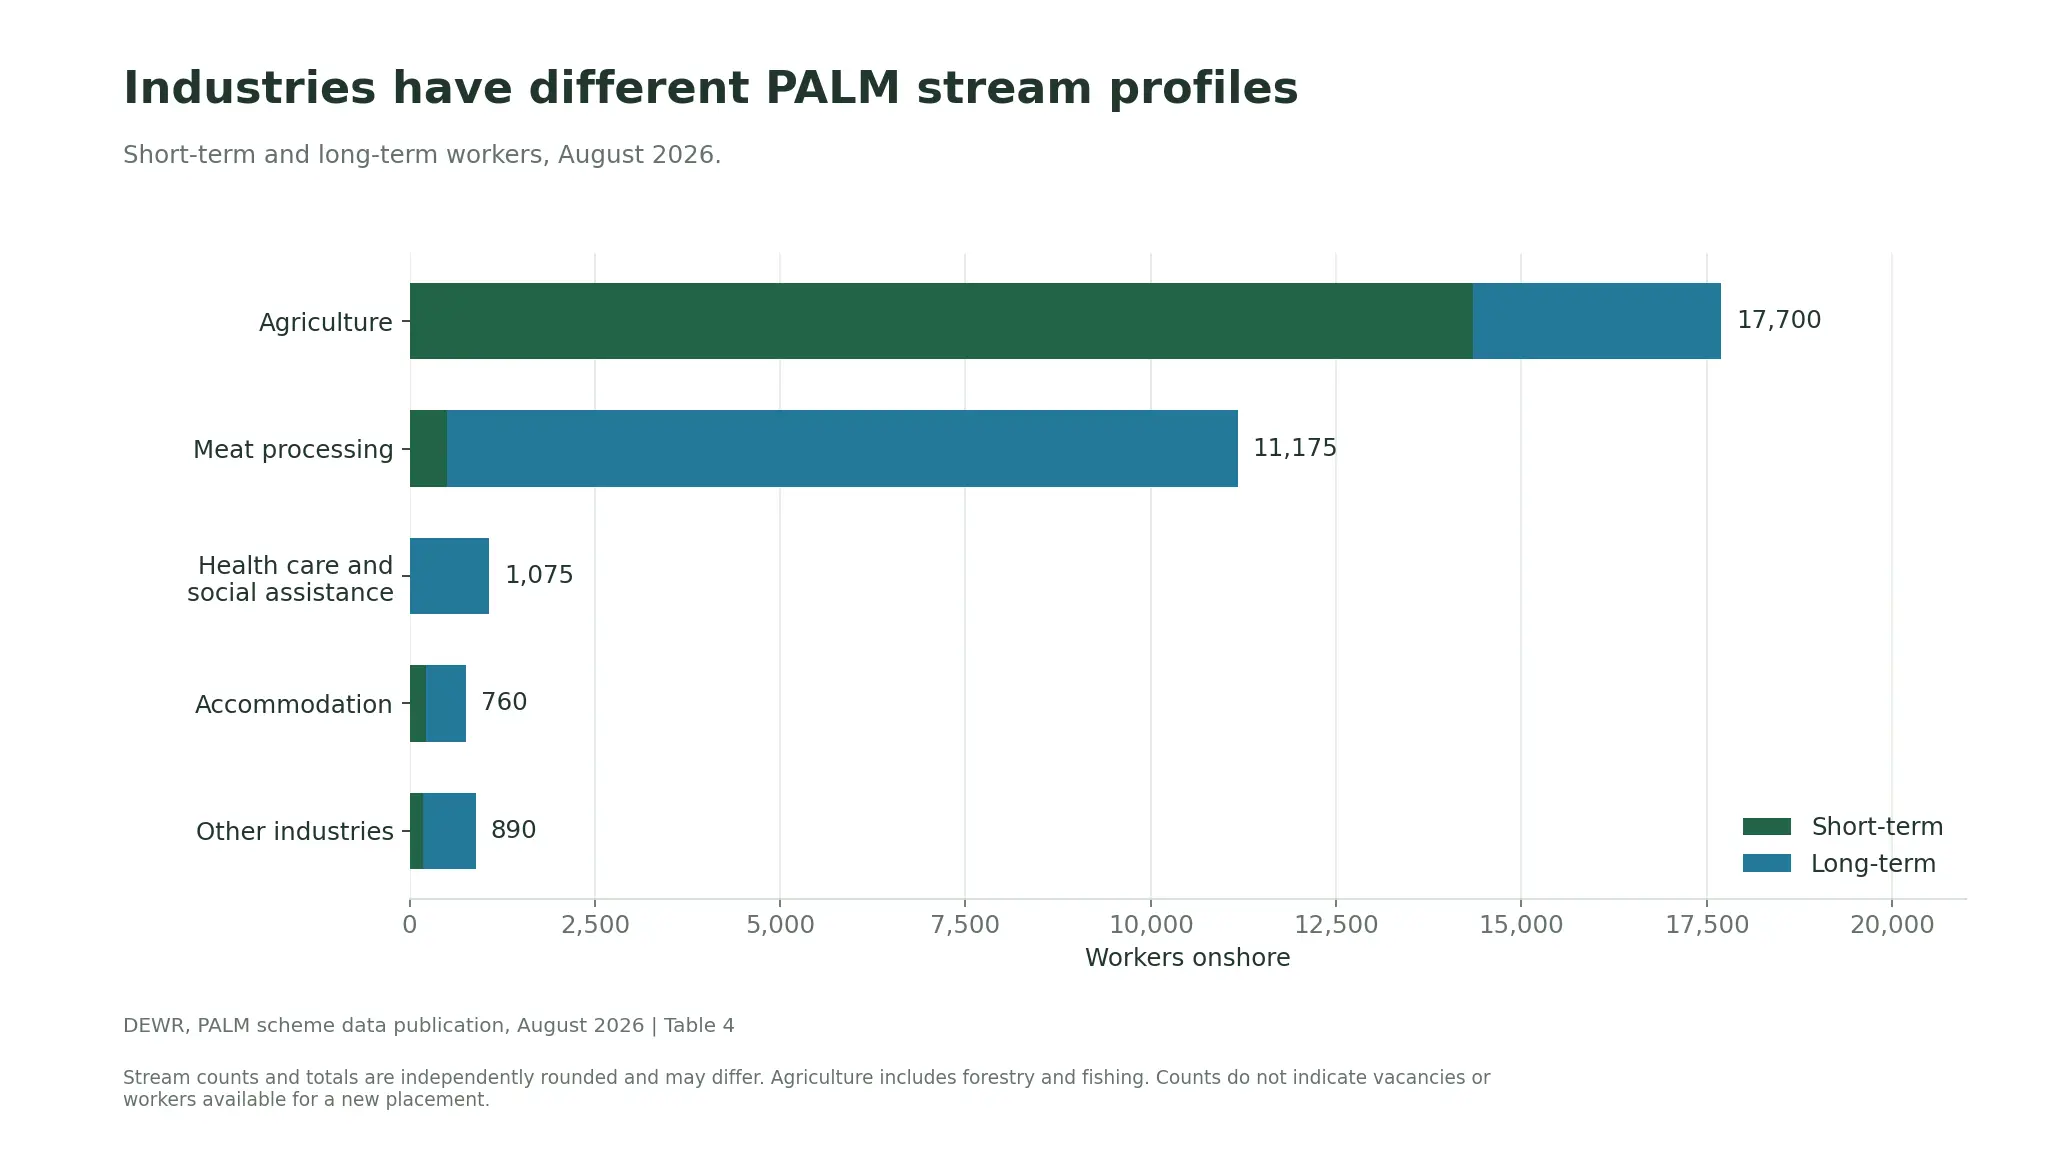
The August workbook records 14,350 short-term and 3,345 long-term agriculture workers. Short-term participants account for approximately 81.1% of the published agriculture total. The components add to 17,695 rather than 17,700 because the source rounds worker figures independently.
Compare that with meat processing: 505 short-term and 10,670 long-term workers. A national statement about PALM’s overall stream mix would therefore be a poor substitute for looking at the industry relevant to the business.
View the data behind this graph
| Industry | Short term | Long term | Published total |
|---|---|---|---|
| Agriculture | 14,350 | 3,345 | 17,700 |
| Meat processing | 505 | 10,670 | 11,175 |
| Health care and social assistance | 0 | 1,075 | 1,075 |
| Accommodation | 220 | 540 | 760 |
| Other industries | 185 | 705 | 890 |
Build the farm plan from tasks and dates
Use the public trend as context, then build a work schedule for the actual property. List the tasks by week and identify the capability required for each. Separate picking, packing, machinery operation and supervision where they require different skills or arrangements.
A practical planning record should distinguish proposed numbers from confirmed people. It should also show the assumptions behind expected hours and what the business will do if the work changes. National participation cannot validate a local hours forecast.
Check whether accommodation, transport and supervision can support the proposed placement at the same time. Our PALM accommodation capacity guide describes why bed counts and recruitment capacity need to be considered separately.
A useful way to explain the data to a grower
An illustrative conversation might begin: “Agriculture participation is higher than the same month last year. Let us now check the people, dates and support arrangements for your proposed work.” The first sentence is grounded in the national release. The second moves to the evidence needed for the farm’s decision.
That distinction also helps when work is urgent. A chart cannot shorten an approval process or turn an indicative start into a confirmed arrival. Review the recruitment timeline early, and use the seasonality explainer when interpreting the next release.
Explore the PALM data series
- PALM Scheme in August 2026: The Numbers Behind the Workforce
- PALM Workers Across Australia: A State Comparison with a Victorian Focus
- Short-Term and Long-Term PALM: How the Workforce Mix Has Changed
- Ten PALM Country Profiles: Participation, Trends and Stream Mix
- Women in the PALM Scheme: What Participation Data Shows
- 565 Approved Employers: Understanding Direct Employment and Labour Hire
- Why PALM Numbers Rise and Fall: Reading Seasonal Workforce Data
Source and method
Source: DEWR PALM scheme data, August 2026 workbook and June 2026 quarterly report, checked 26 October 2026. Charts and calculations are Orchard Tech’s analysis. Worker counts are privacy-rounded to the nearest five; components may not sum to totals. Employer counts are not rounded. Percentages calculated from rounded counts are approximate.
The views expressed in this report are those of the authors and do not necessarily represent those of DEWR.
About the author
Hari Yellina is Chief Executive Officer at Orchard Tech. His articles cover agricultural workforce planning, labour hire and practical workplace responsibilities.