PALM Workers Across Australia: A State Comparison with a Victorian Focus
• Hari Yellina
PALM data series | Data period: August 2026 | Reviewed: 26 October 2026
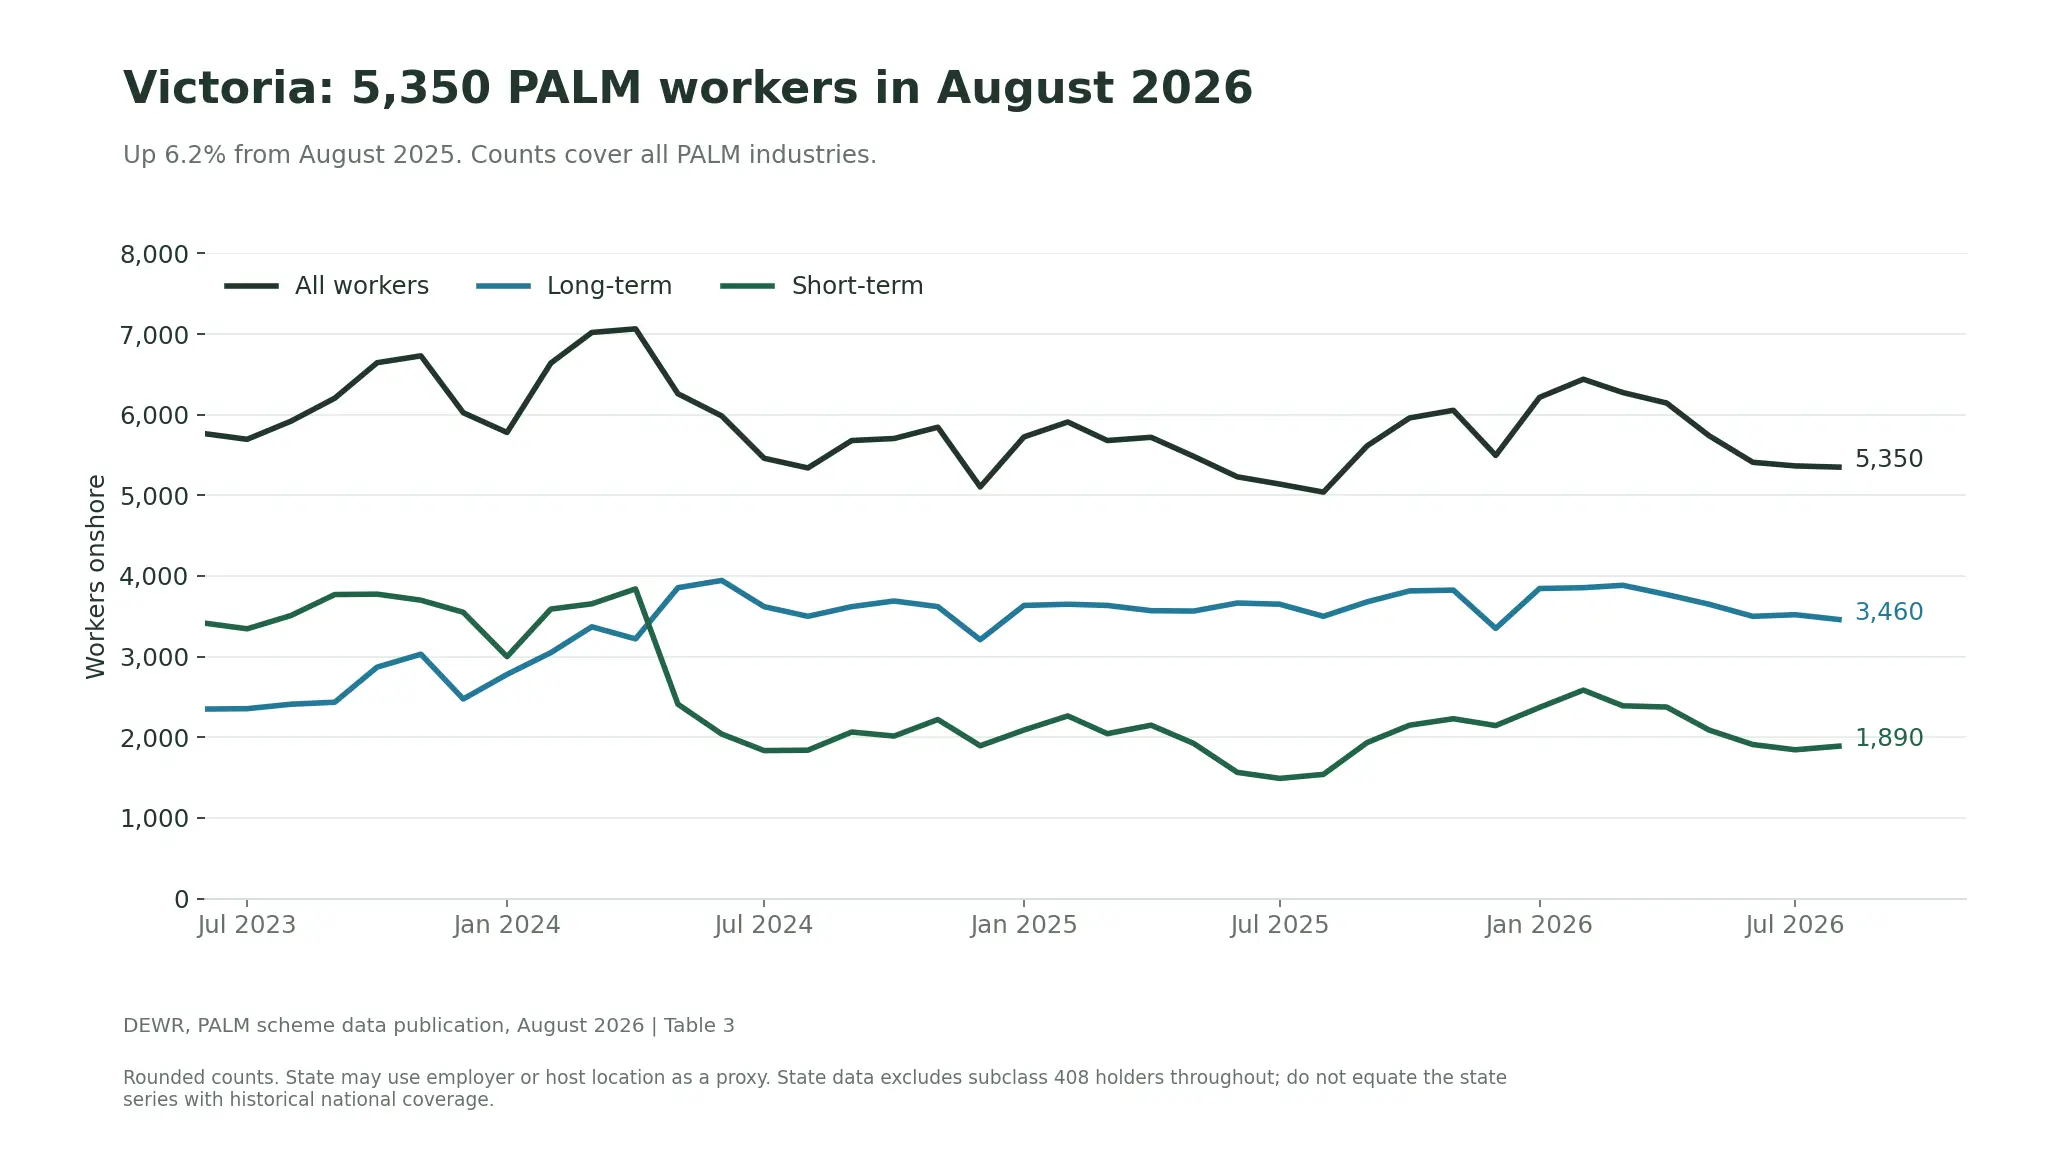
Victoria had 5,350 PALM workers in August 2026, compared with 5,040 in August 2025. That is an increase of 310, or approximately 6.2%. The figure is useful regional context, but it covers all PALM industries rather than Victorian horticulture alone.
A state comparison helps growers see the scale and composition of participation. To use it well, keep location, industry and availability as separate questions.
Queensland has the largest recorded participation
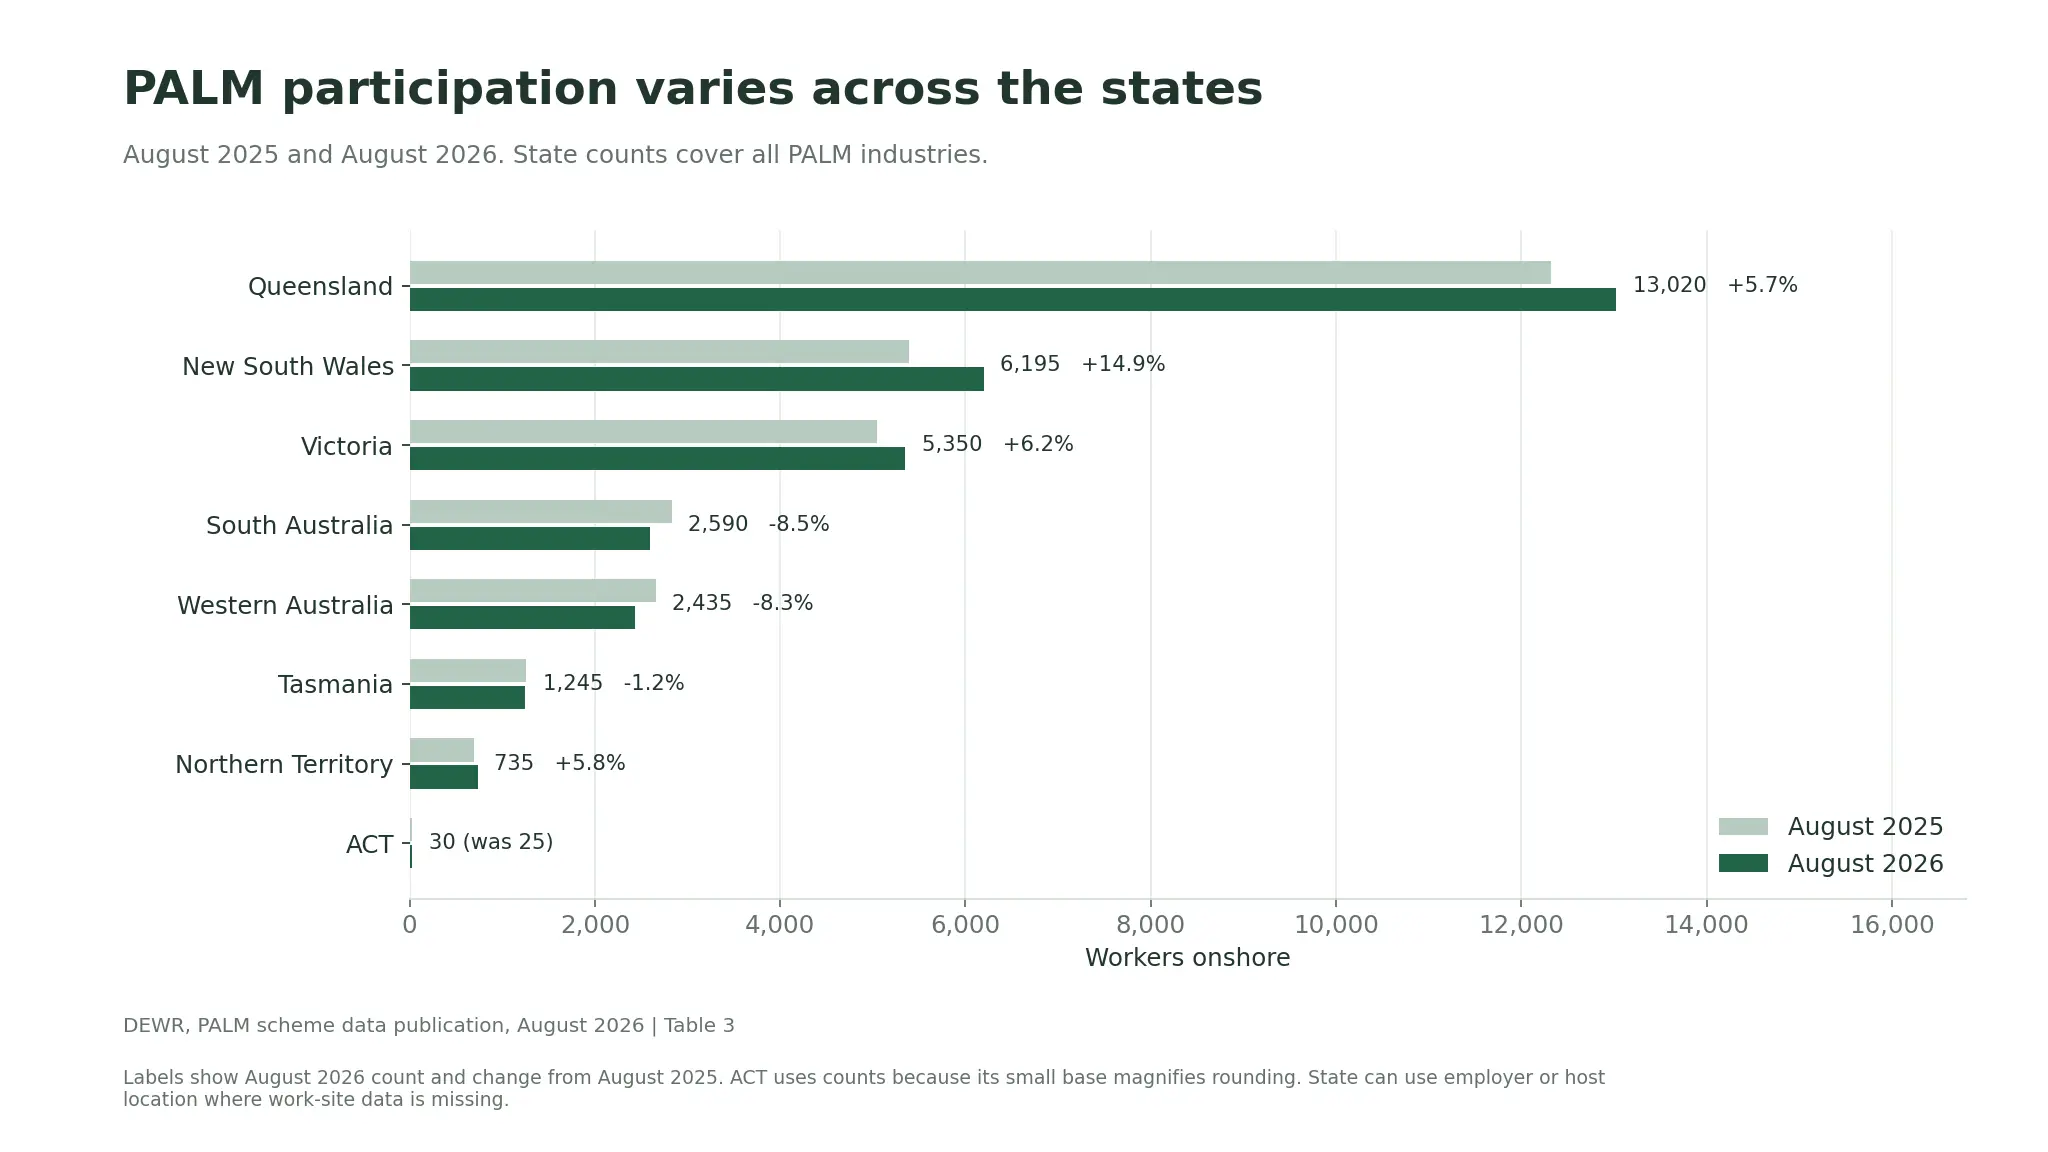
Queensland’s August total was 13,020, followed by New South Wales with 6,195 and Victoria with 5,350. South Australia recorded 2,590, Western Australia 2,435, Tasmania 1,245, the Northern Territory 735 and the ACT 30.
The annual direction differed across jurisdictions. New South Wales increased by approximately 14.9%, Queensland by 5.7% and Victoria by 6.2%. South Australia and Western Australia recorded lower counts than a year earlier. These are participation comparisons; they do not show whether employers had more vacancies or found recruitment easier.
View the data behind this graph
| State | August 2025 | August 2026 | Annual change pct |
|---|---|---|---|
| Queensland | 12,315 | 13,020 | 5.7 |
| New South Wales | 5,390 | 6,195 | 14.9 |
| Victoria | 5,040 | 5,350 | 6.2 |
| South Australia | 2,830 | 2,590 | -8.5 |
| Western Australia | 2,655 | 2,435 | -8.3 |
| Tasmania | 1,260 | 1,245 | -1.2 |
| Northern Territory | 695 | 735 | 5.8 |
| Australian Capital Territory | 25 | 30 | 20.0 |
For the ACT, a change from 25 to 30 is clearer than a percentage headline. Small rounded counts can produce a large-looking percentage from a very small numerical difference. The graph therefore displays the counts directly.
Victoria’s total needs its own time series
The monthly Victorian series shows movements that an annual comparison alone cannot describe. In August 2026, Victoria had 1,890 short-term and 3,460 long-term participants. The long-term group represented approximately 64.7% of its total, above the national long-term share of 51.7%.
This does not mean that almost two-thirds of Victorian fruit pickers are long-term PALM participants. The state measure includes every industry within scope, and the publication does not cross-tabulate state with industry. Combining two separate tables cannot fill that gap.
View the data behind this graph
| Month | Total | Short term | Long term |
|---|---|---|---|
| 2023-06 | 5,765 | 3,415 | 2,350 |
| 2023-07 | 5,695 | 3,345 | 2,355 |
| 2023-08 | 5,920 | 3,510 | 2,410 |
| 2023-09 | 6,205 | 3,770 | 2,435 |
| 2023-10 | 6,645 | 3,775 | 2,870 |
| 2023-11 | 6,730 | 3,700 | 3,030 |
| 2023-12 | 6,025 | 3,550 | 2,475 |
| 2024-01 | 5,780 | 3,000 | 2,780 |
| 2024-02 | 6,640 | 3,590 | 3,050 |
| 2024-03 | 7,020 | 3,655 | 3,370 |
| 2024-04 | 7,065 | 3,840 | 3,220 |
| 2024-05 | 6,260 | 2,410 | 3,855 |
| 2024-06 | 5,985 | 2,040 | 3,945 |
| 2024-07 | 5,460 | 1,835 | 3,620 |
| 2024-08 | 5,340 | 1,840 | 3,500 |
| 2024-09 | 5,680 | 2,065 | 3,620 |
| 2024-10 | 5,705 | 2,015 | 3,690 |
| 2024-11 | 5,845 | 2,220 | 3,620 |
| 2024-12 | 5,105 | 1,895 | 3,210 |
| 2025-01 | 5,725 | 2,090 | 3,635 |
| 2025-02 | 5,910 | 2,265 | 3,650 |
| 2025-03 | 5,680 | 2,045 | 3,635 |
| 2025-04 | 5,720 | 2,150 | 3,570 |
| 2025-05 | 5,485 | 1,925 | 3,565 |
| 2025-06 | 5,230 | 1,565 | 3,665 |
| 2025-07 | 5,140 | 1,490 | 3,650 |
| 2025-08 | 5,040 | 1,540 | 3,500 |
| 2025-09 | 5,615 | 1,935 | 3,680 |
| 2025-10 | 5,960 | 2,150 | 3,815 |
| 2025-11 | 6,055 | 2,230 | 3,825 |
| 2025-12 | 5,495 | 2,145 | 3,350 |
| 2026-01 | 6,215 | 2,370 | 3,845 |
| 2026-02 | 6,440 | 2,585 | 3,855 |
| 2026-03 | 6,275 | 2,390 | 3,885 |
| 2026-04 | 6,145 | 2,375 | 3,770 |
| 2026-05 | 5,740 | 2,090 | 3,650 |
| 2026-06 | 5,410 | 1,910 | 3,500 |
| 2026-07 | 5,365 | 1,845 | 3,520 |
| 2026-08 | 5,350 | 1,890 | 3,460 |
States differ in stream composition as well as size
Queensland recorded 7,330 short-term and 5,690 long-term participants. New South Wales recorded 1,865 and 4,330 respectively. South Australia’s published short-term count was 1,745, compared with 845 long-term workers.
These profiles explain why a national average can be a weak guide to a particular region. They still do not establish which workers could move, their current commitments, or the requirements for a proposed placement.
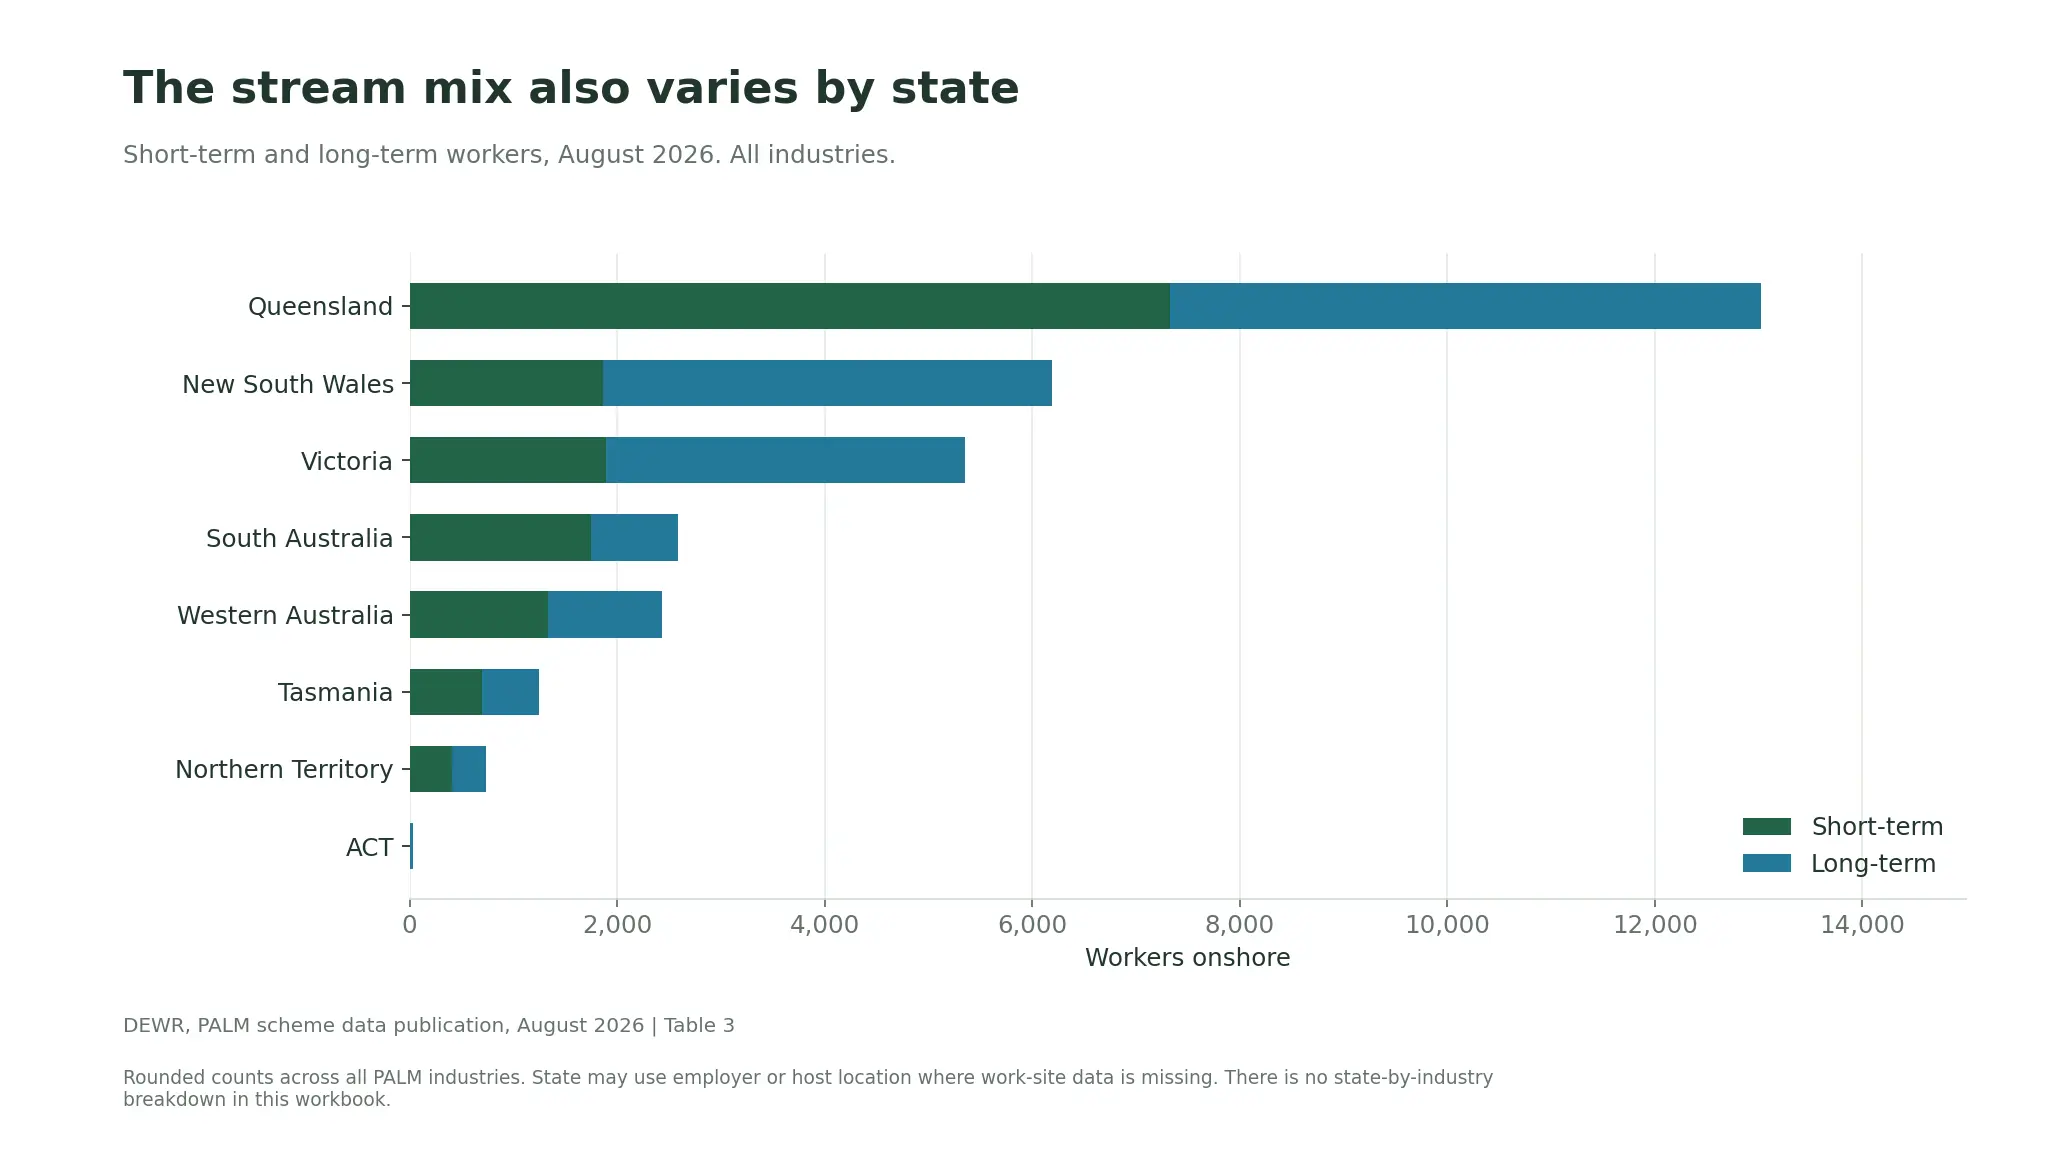
View the data behind this graph
| State | Short term | Long term | Total |
|---|---|---|---|
| Queensland | 7,330 | 5,690 | 13,020 |
| New South Wales | 1,865 | 4,330 | 6,195 |
| Victoria | 1,890 | 3,460 | 5,350 |
| South Australia | 1,745 | 845 | 2,590 |
| Western Australia | 1,330 | 1,105 | 2,435 |
| Tasmania | 695 | 550 | 1,245 |
| Northern Territory | 405 | 330 | 735 |
| Australian Capital Territory | 0 | 30 | 30 |
Understand how location is assigned
DEWR uses work-site information where available. Employer or host location may be used when work-site information is missing. The state field should therefore be read as the publication’s location classification, not a precise live map of every participant.
The workbook does not identify individual farms, towns, crops or labour-hire providers. It cannot resolve a question such as “How many uncommitted pickers are near our orchard next week?” That needs current information from the people managing actual placements.
Use three layers for a Victorian workforce discussion
Start with the state context, then move to the crop and business, then to the confirmed placement. At the first layer, record the reporting month and the annual comparison. At the second, establish tasks, location, dates and expected work. At the third, confirm people, capability and support arrangements.
For example, an orchard can reasonably use the 6.2% annual increase as context in a planning meeting. It should not increase a booking assumption by 6.2% without evidence that the additional people, accommodation and work are actually available. This is a planning distinction, not a finding about any particular Orchard Tech client.
Read the national agriculture analysis alongside this state article. Then use the accommodation capacity guide to check the practical conditions for the proposed crew.
Explore the PALM data series
- PALM Scheme in August 2026: The Numbers Behind the Workforce
- 17,700 PALM Workers in Agriculture: What the Data Means for Growers
- Short-Term and Long-Term PALM: How the Workforce Mix Has Changed
- Ten PALM Country Profiles: Participation, Trends and Stream Mix
- Women in the PALM Scheme: What Participation Data Shows
- 565 Approved Employers: Understanding Direct Employment and Labour Hire
- Why PALM Numbers Rise and Fall: Reading Seasonal Workforce Data
Source and method
Source: DEWR PALM scheme data, August 2026 workbook and June 2026 quarterly report, checked 26 October 2026. Charts and calculations are Orchard Tech’s analysis. Worker counts are privacy-rounded to the nearest five; components may not sum to totals. Employer counts are not rounded. Percentages calculated from rounded counts are approximate.
The views expressed in this report are those of the authors and do not necessarily represent those of DEWR.
About the author
Hari Yellina is Chief Executive Officer at Orchard Tech. His articles cover agricultural workforce planning, labour hire and practical workplace responsibilities.